")

")
- $10,000 cost to society per $ million of company revenue
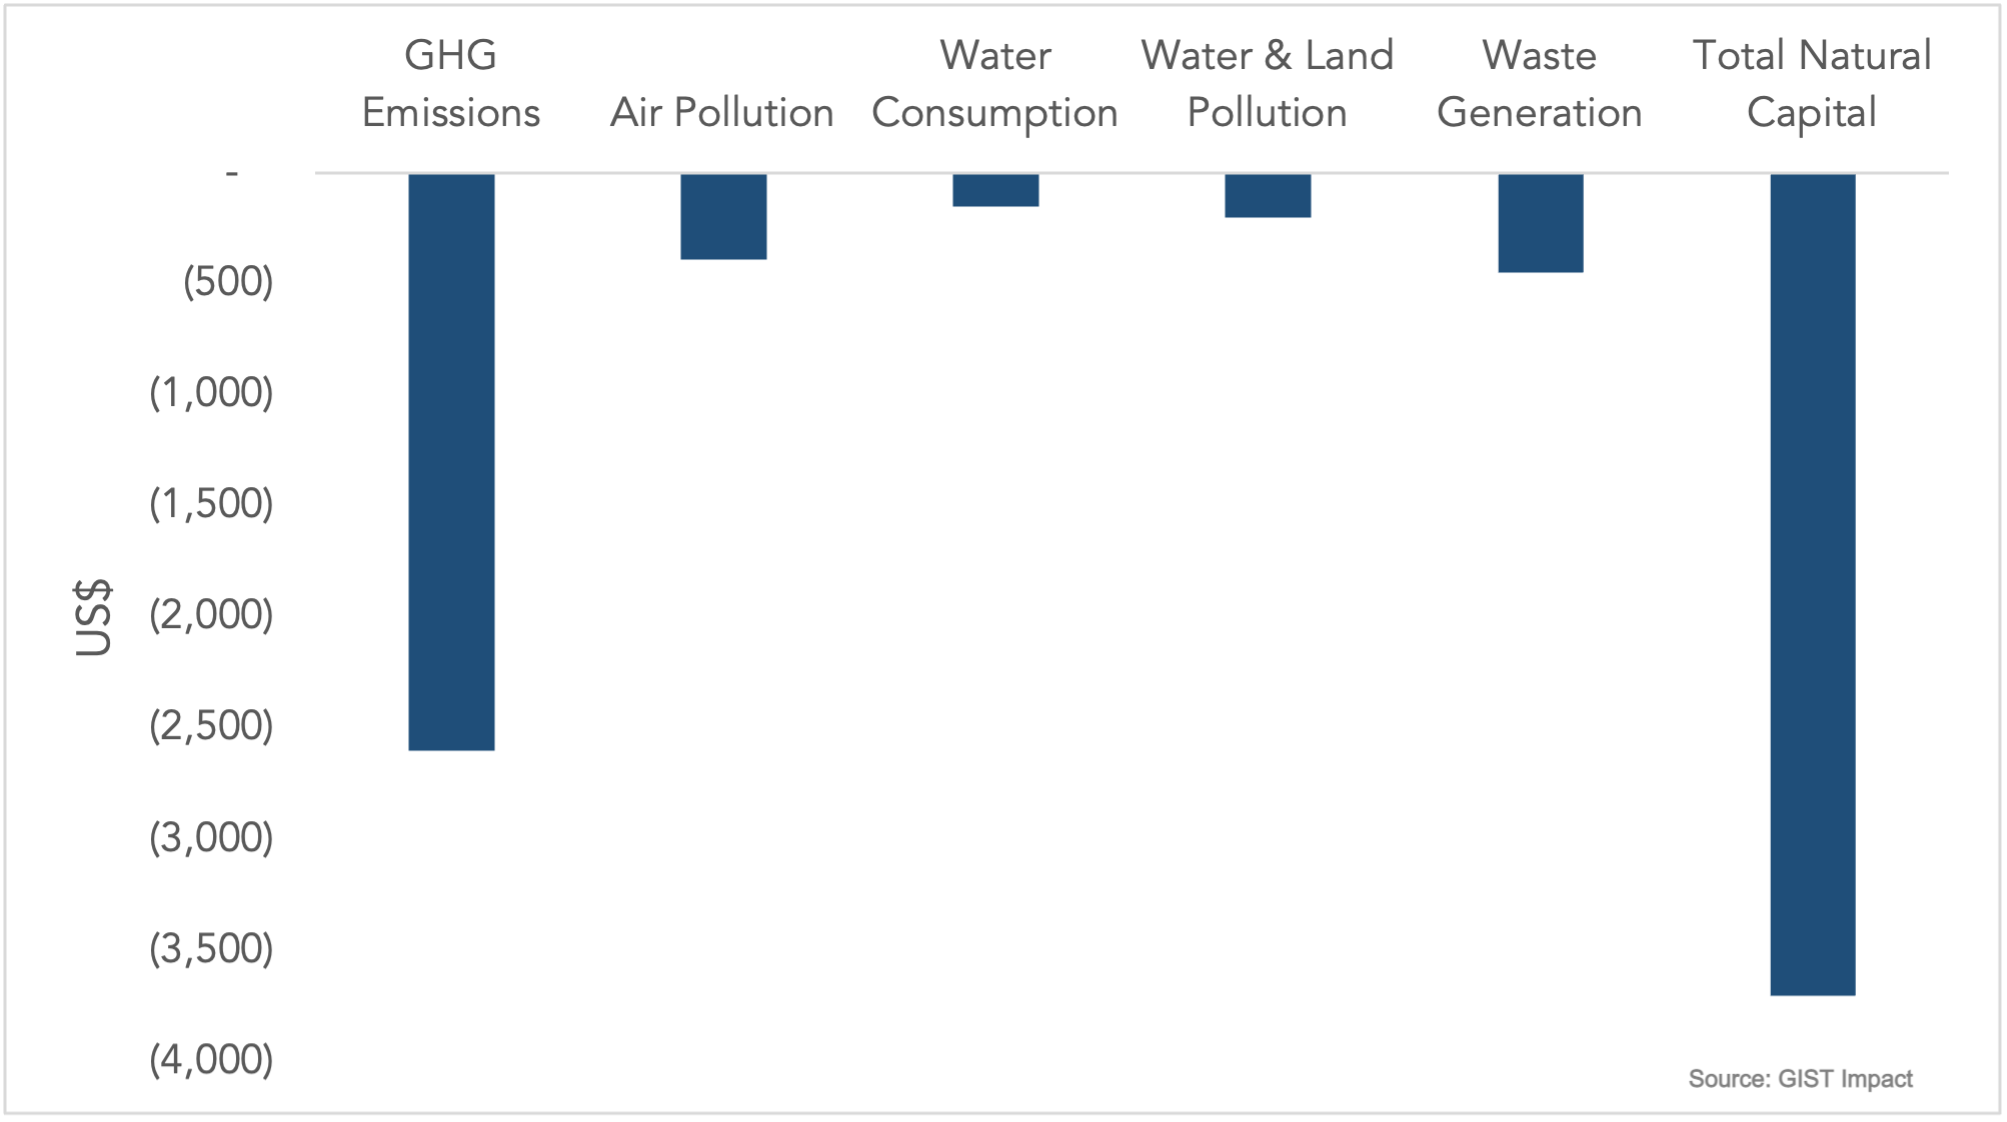
- $3,700 cost to society per $ million invested
- GHGs dominate in reporting
- Zero improvement in waste management in recent years
Fund managers returning to their desks following the Independence Day barbecues, were most likely unaware that each million dollars they commit to a well-known US index of the 500 top US companies generates $3,700 of negative environmental impact from companies’ operations alone. These same investors may have been less surprised to discover that nearly 70% of that cost was a result of greenhouse gas (GHG) emissions, with a little over 10% for each of air pollution and waste generation.
$ Environmental Impact per $ 1 million invested in US Large Caps (July 2022)
The fund managers would most likely be familiar with the sectors that are the greatest cause of this externality, which is paid for by wider society rather than by investee companies or their shareholders. By far the largest contribution to these costs, both overall and in terms of GHG, are generated in the utilities sector. The Materials and Energy sectors round out the top three emitters.
Natural Capital Impact Intensity by Sector
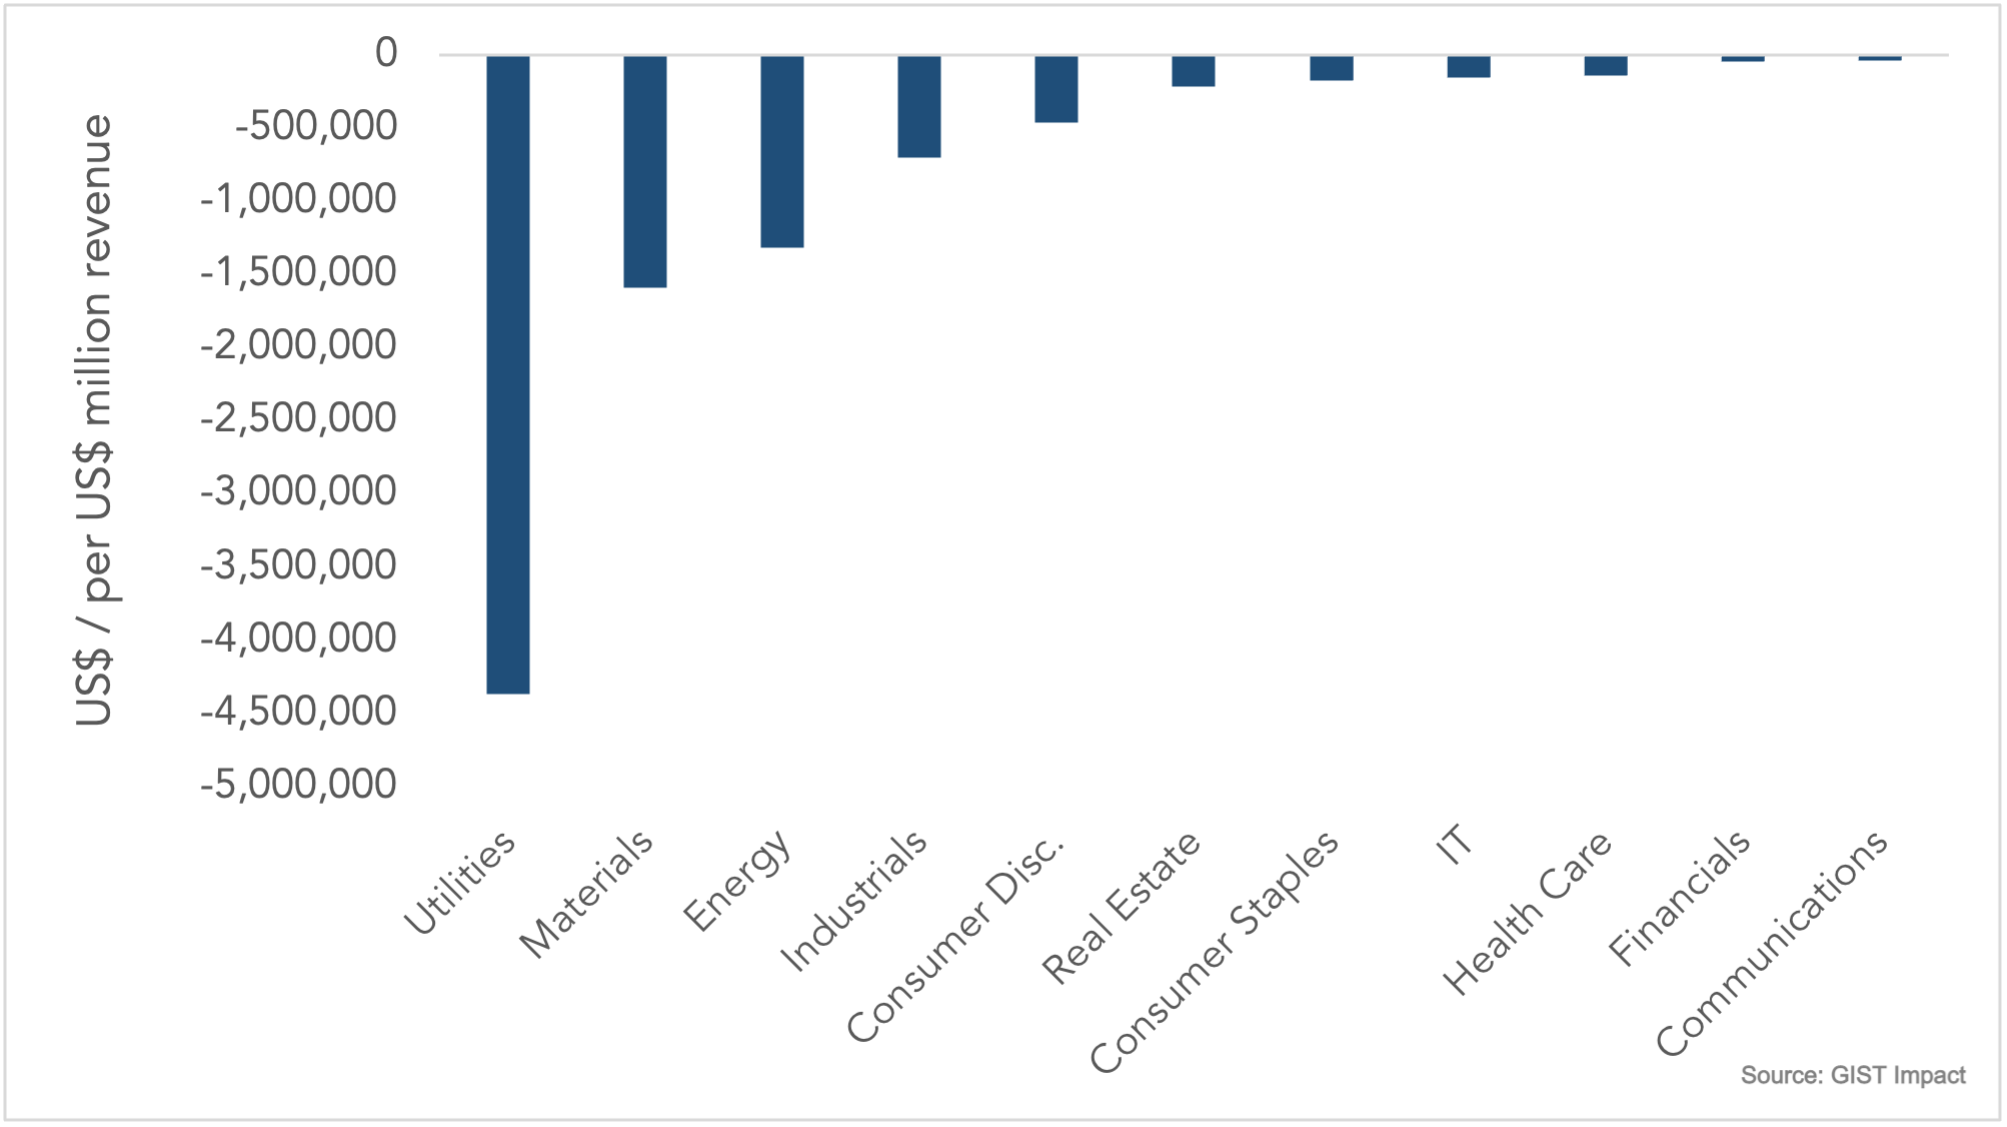
Environmental impact intensity is measured as the $ cost per $ million of revenue. The high-level sectoral analysis may be broken down further.
Top Ten Natural Capital Impact Intensities by Sub-Sector

With impact intensity much higher for a handful of sectors than the norm, it is perhaps unsurprising the most recent Global Sustainable Investment Review reported that negative screening accounted for 25% of all ESG investment strategies, compared with just 2% for positive screening. Throw in tobacco, weapons and animal testing alongside high polluters and there is an out-of-the-box ESG-labelled strategy for minimum effort.
Such an investment strategy, however, is far from sustainable. Regulators around the world are ratcheting up disclosure requirements for fund managers, meaning that data needs to be collected and reported on investment holdings in order to justify claims about the sustainable characteristics and objectives of funds. At the same time, sustainability investors want to make their own assessments of the companies and sectors that they expect to deliver the greatest improvement in negative impact, and to validate their thesis using real data.
Avg. Annual % Change in Natural Capital Impact Intensity (2016-20)
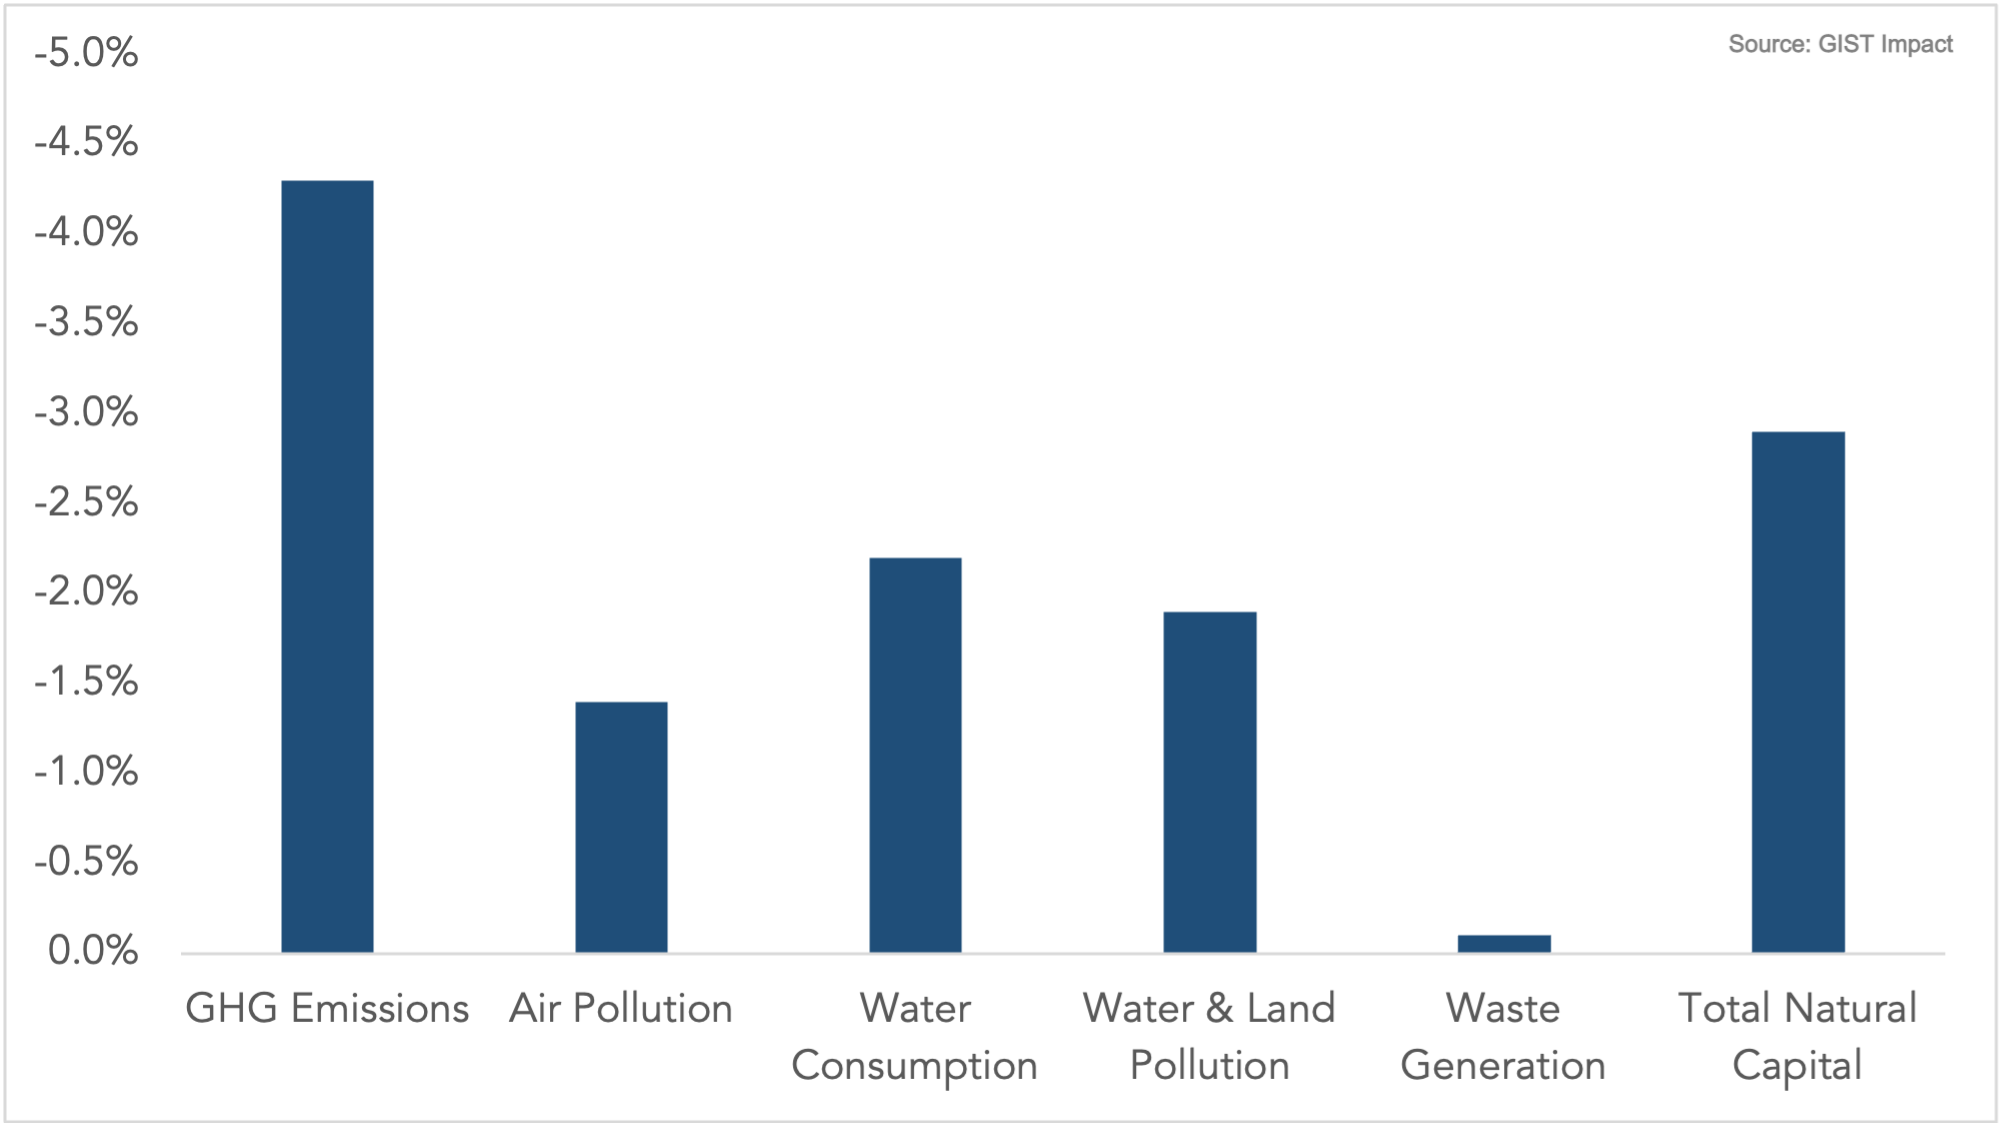
The regulatory, media and customer focus on climate, and GHG as the major cause of its change, has coincided with a faster average reduction in impact in this area among US large caps than for other environmental factors. Mainstream ESG metrics tend to focus on GHG and water consumption, with less attention paid to the damage caused by air pollution, water and land pollution, or the waste from companies’ operations. This has coincided with virtually no change in the impact intensity of waste generation and a rise in its overall cost, given the growth of large cap revenues in recent years. Truly what is measured is what is managed, and companies and investors are not measuring enough.
GIST Impact generates a series of investment benchmarks to assist fund managers in measuring and managing the impact of their funds and in validating their investment theses about which companies will improve the most.
Table 1: US Large Cap Natural Capital Benchmarks
| Factor | Metric | Impact Intensity ($ / Million $ Revenue) | CAGR | Environmental Cost ($ / Million $ Invested) |
|---|---|---|---|---|
| Climate | GHG Emissions | 12,180 | -4% | 2,500 |
| Pollution | Air | 2,300 | -1% | 400 |
| Water and Land | 1,700 | -2% | 190 | |
| Environment | Water Consumption | 800 | -2% | 150 |
| Waste Generation | 1,800 | 0% | 450 |

")