
")
As a data and analytics provider, GIST Impact works deep in the weeds of clients’ annual reporting cycles. At the core of our work is providing the most robust, science-based data on nature and biodiversity – and guiding clients on how to use these insights and apply it to their portfolios and assets.
This article uses three examples to provide a step-by-step walkthrough of how nature risk becomes financial risk.
What leading institutions have in common
The investors and companies leading the charge in nature reporting share key characteristics. They see nature data as pre-financial data. Non-financial is a misnomer: it’s financial data, just with a different timescale – a heads-up on real risks that will materialise in the future.
Because they view this as pre-financial data, reporting is only the beginning. Their goal is to use this data to mitigate and manage risks, treating it as decision-making intelligence.
How nature risk becomes financial risk
As a starting point, it’s helpful to understand two mechanisms that illustrate the link between nature risk and financial risk – namely carbon markets and 30×30 – both of which investors are starting to pay more attention to.
1. Carbon markets = More externalities being internalised
Today, greenhouse gas externalities are starting to be internalised through carbon pricing, emissions trading schemes, and carbon taxes. In the future, more environmental externalities will follow suit. Markets may price in the societal cost of water consumption or waste generation. Investors can already examine externalities data to identify early signs of risk in their portfolio companies.
2. 30×30 = More corporate stranded assets
If we achieve 30×30 targets (the global conservation goal to protect and conserve 30% of the Earth’s land and ocean by the year 2030 to halt biodiversity loss, adopted by nearly 200 countries under the United Nations Biodiversity Framework), more land will come under protection – meaning companies are more likely to have stranded assets that can’t operate as before. Data from partners like IBAT helps investors identify where portfolio company assets are located and whether they’re close to or intersecting with sensitive locations or biodiversity hotspots.
Now that the link between nature risk and financial risk has been established, the question is: how are these mechanisms addressed in practice? Let’s take a look at a few examples.
Example 1: The world’s largest pension fund
Asset owners have emerged as leaders in nature-related financial analysis, driven by their long-term investment horizons spanning decades or even centuries.
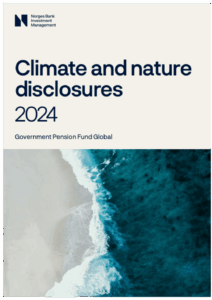
Norges Bank Investment Management (NBIM), the world’s largest sovereign wealth fund – managing $1.7 trillion in assets (1.5% of every single company globally), exemplifies this forward-thinking approach. In their Climate and Nature Disclosures Report, published in December of 2024, they stated:
“It is becoming increasingly clear that the climate system and ecosystems are closely linked and mutually dependent. To understand the fund’s financial risk exposures we need to analyse both climate and nature risks.”
The Report offers a detailed analysis of their natural capital impacts and sensitive location risks – demonstrating that nature reporting is already influencing trillion-dollar portfolios.
Example 2: The world’s largest insurance firm
The below graph is a behind-the-scenes look at how one of the world’s largest insurance firms is looking at impacts and dependencies across a portfolio. This is nature risk analysis in practice, and it involves a sophisticated portfolio screening processes using a two-dimensional approach:
(The intent here is not to focus on the exact datapoints of the graph, but rather to show the scope of considerations and the structure used to map impacts and dependencies across a portfolio.)
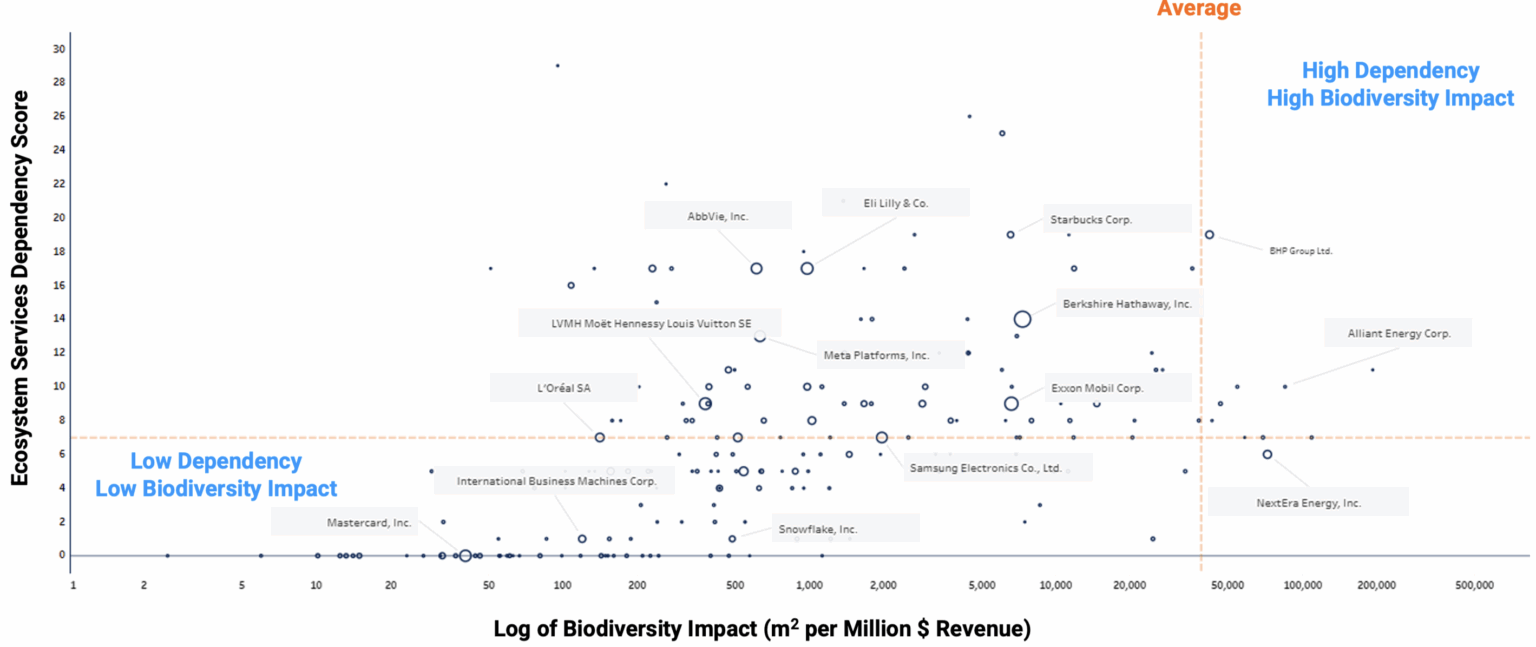
In a nutshell:
- X-axis: Companies ordered by biodiversity impact, identifying those affecting global biodiversity most significantly
- Y-axis: Dependency levels, showing which companies heavily rely on ecosystem services under stress or depletion
The insurer is using this data to build a multi-stage screening process with thresholds for filtering companies with the highest impact and dependencies. This informs portfolio rebalancing and investee company engagement.
This is far from a tick-box reporting exercise. These institutions are integrating new and important datasets into their workflows with the aim of making fundamentally different decisions.
Example 3: A major global IT company
While investors can influence change by redirecting capital, companies themselves are responsible for the majority of pressures on nature. Real change happens at the company level through retrofits, abatement measures, and operational improvements.
The hidden costs of pollution, visible through natural capital impact assessment
A recent Financial Times article highlighted that “Pollution from Big Tech’s data centre boom costs US public health $5.4 billion.” While the current administration might not act on this information, future administrations might.
Our client, Wipro, has been ahead of the curve. For the last five years, they’ve been actively managing air pollution impacts in their data centres after a natural capital impact assessment identified it as a material risk. Have a look at their 2025 Sustainability Report (pg 50-53) for more information.
This demonstrates the power of getting ahead of the curve and pre-empting risk using nature-related data.
The lesson?
It bears repeating that the investors and companies leading the charge in nature reporting have one major thing in common: they acknowledge nature data as pre-financial data.
What sets these leading institutions apart is their understanding that reporting is only the beginning. Their goal is to use nature data to mitigate and manage risks – treating it as decision data, not disclosure data. This shift from compliance to action is what turns non-financial reporting into a real turning point for nature.

")