

“Reefs damaged by oil spill in the Gulf of Mexico.”
“87% of Malaysia’s sensitive marine environments sit directly in offshore oil production zones.”
Headlines like these are indeed surfacing more often, and they share a common thread in that the risk was there long before it made the news, but nobody had the means to see it.
Today, we’re aiming to close that gap. In partnership with Hub Ocean, GIST Impact has launched Ocean Sensitive Areas — a new module on our Data Portal that brings scientific-grade, decision-ready ocean intelligence to the organisations that need it most: asset managers, asset owners, banks, insurers, and the corporates whose assets, operations and value chains touch the sea.
Why the ocean has been a blind spot
For all the momentum behind terrestrial nature risk and climate — we all know how important oceans are at regulating temperature — the ocean has remained rather stubbornly off the radar. There are two reasons. Firstly, decision-ready data has been scarce — there is plenty of marine science, but little of it structured for a risk register or an investment committee. Secondly, the ocean is vast and largely out of sight; without the constant human presence that surrounds land-based ecosystems, emerging risks are far harder to observe and monitor in real time.
The result is a reactive posture — the conversation starts only after the spill, the fine, or the production disruption. However, ocean-related dependencies and impacts are already financially material, and the frameworks are catching up surprisingly fast.

What are Ocean Sensitive Areas?
Our Ocean Sensitive Areas dataset screens the proximity of a company’s physical assets to sensitive marine ecosystems and protected waters. Built with Hub Ocean and drawing on authoritative, globally recognised datasets, it spans six layers:*
- Marine Protected Areas
- Mangroves
- Cold-Water Coral
- Seamount Bases
- Tropical Coral Reefs
- Seagrass
*Data sourced via our Hub Ocean partnership from ProtectedSeas Navigator V2, Global Mangrove Watch (Bunting et al. 2022), Yesson et al. 2020, and the Allen Coral Atlas.
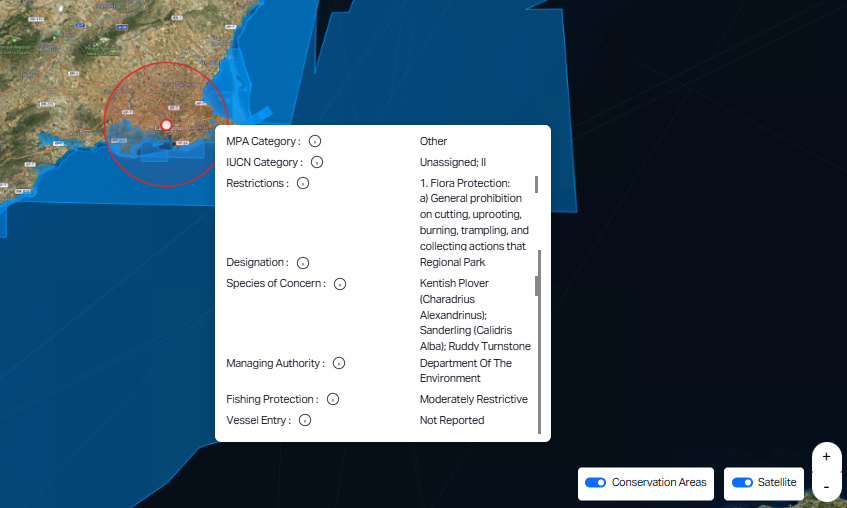
Coverage is available off-the-shelf for a universe of about 10,000 companies, delivering intelligence at both the asset and portfolio level. The Marine Protected Areas layer is the most extensive, because its source is a regulatory database. Alongside location, this layer includes governance details — designation, managing authority, IUCN (International Union for Conservation of Nature) category, and whether activities such as fishing, dredging, extraction, anchoring and construction are Allowed, Restricted, or Prohibited.
The dataset in practice
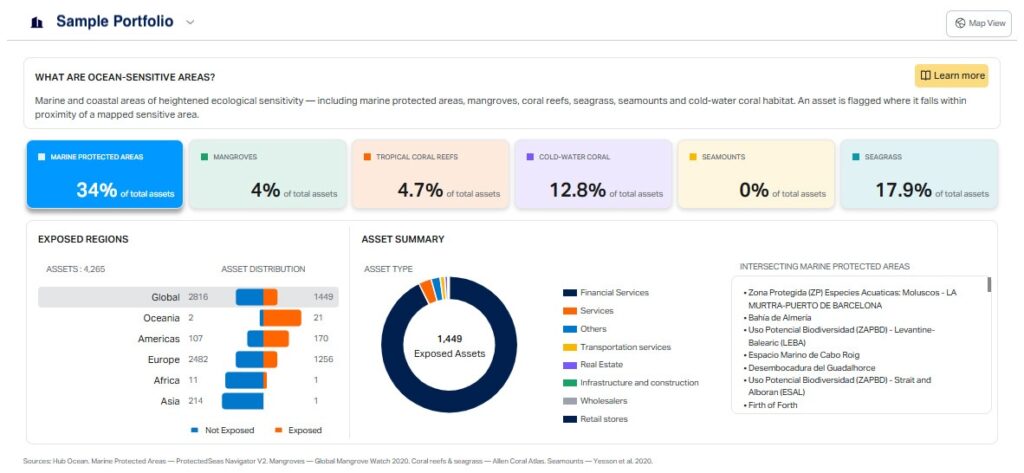
Looking at a sample portfolio below, the top row of figures shows each layer’s share of exposed assets: Marine Protected Areas lead at 34%, followed by seagrass (17.9%) and cold-water coral (12.8%), with smaller shares in tropical coral reefs, mangroves, and none in seamounts.
The Exposed Regions chart then breaks these assets down by geography, with the Global and European Summary donut chart shows what’s driving that exposure by asset type, while the right-hand panel names the specific Marine Protected Areas those assets intersect.
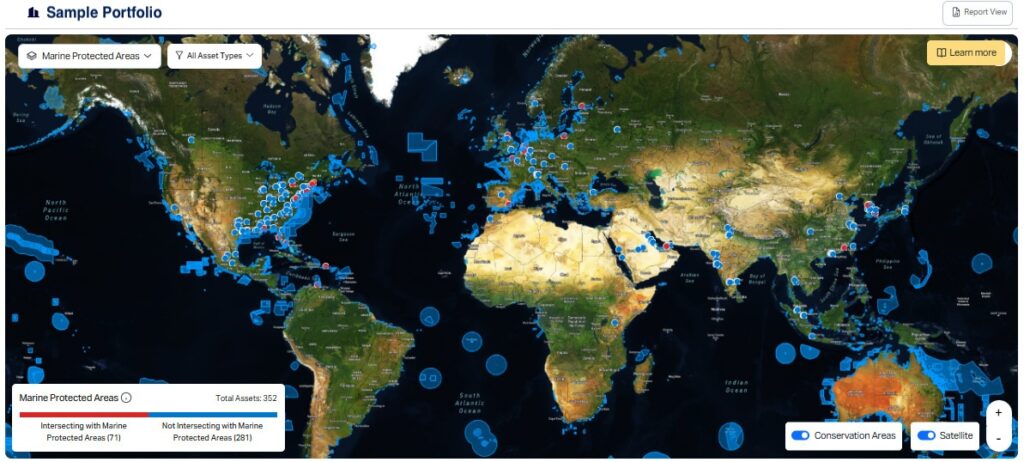
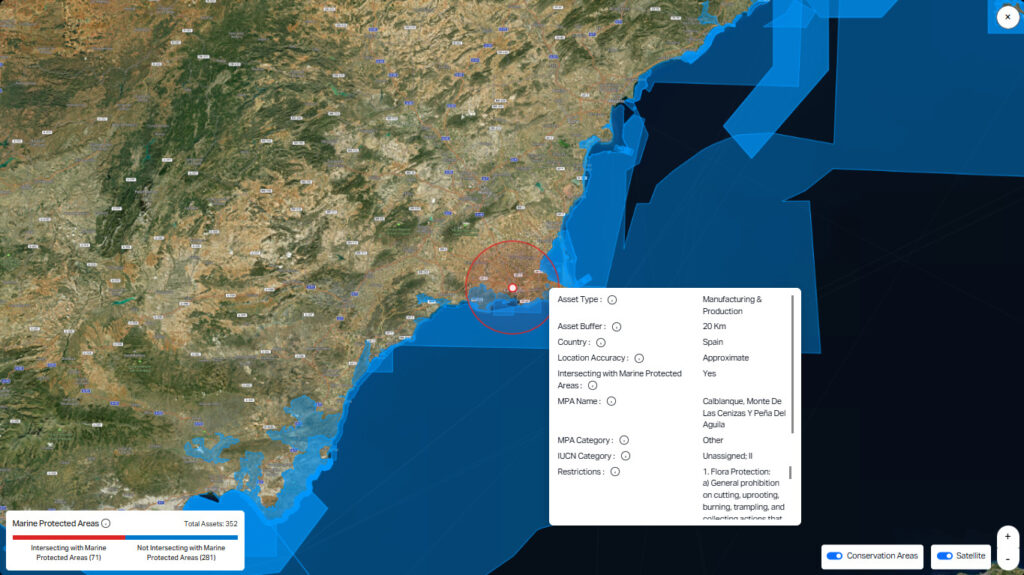
The world map is the same analysis viewed spatially: every asset is geolocated and plotted against the selected layer, with points coloured by whether they intersect a Marine Protected Area (red) or not (blue). It turns thousands of holdings into a map you can scan for clusters — in this example, 71 of 352 assets intersect a protected area — and you can switch layers, filter by asset type, or zoom to any coastline to inspect an individual site.
How it works
Generally, the mechanics are deliberately straightforward. For each layer, we geolocate a company’s assets and check their proximity to the mapped feature within a defined buffer distance. Where a layer carries governance detail, that is reported alongside the proximity flag. Asset-level results across all six layers then roll up into company-level exposure metrics — turning thousands of holdings into a ranked, mapped view of where ocean risk is actually concentrated.
Buffer distances follow IBAT’s recommended thresholds for biodiversity significance assessment — 5, 10, 20 and 50 km by asset type, with finer increments available. Need something bespoke? GeoIQ, our platform for private assets, lets you search any location on Earth by latitude/longitude or address and to set your own buffer.
Why it matters for investors, corporates and operators
For financial institutions, the two questions this dataset addresses are: how exposed is the portfolio to sensitive marine ecosystems? And also, which holdings sit inside Marine Protected Areas and the regulatory constraints that come with them? The module supports portfolio screening, stewardship prioritisation, and underwriting and risk pricing — flagging the names carrying elevated biodiversity and regulatory risk before they surface as a liability.
For corporates and operators — of shipping facilities, offshore energy, coastal infrastructure, aquaculture and fisheries — the lens is operational: which assets sit within or near protected waters? Are planned activities allowed, restricted, or prohibited? Where do permitting and compliance risks lie, early enough in site selection or expansion to actually act on them?
Built for the frameworks you already report against
Ocean Sensitive Areas is designed to feed directly into disclosure. It supports the Locate stage of the TNFD’s LEAP approach, provides the location-specific evidence CSRD ESRS E4 expects on biodiversity impacts, dependencies, risks and opportunities, and maps to the Kunming-Montreal Global Biodiversity Framework (Targets 3, 14 and 15).
However, a note on scope: this is a location-based screening tool, not an impact-magnitude assessment. It tells you which assets warrant a closer, site-specific look — the objective first filter, not the final word.
See it in your own portfolio
The reefs blackened by oil, the marine environments found sitting inside production zones — the signal is almost always there before the story is. Ocean Sensitive Areas is about seeing it while you can still act.
Access it through our Data Portal, self-serve via GeoIQ, or by SFTP and offline delivery straight into your systems.
If you’d like a demo of our new dataset, chat to our team.