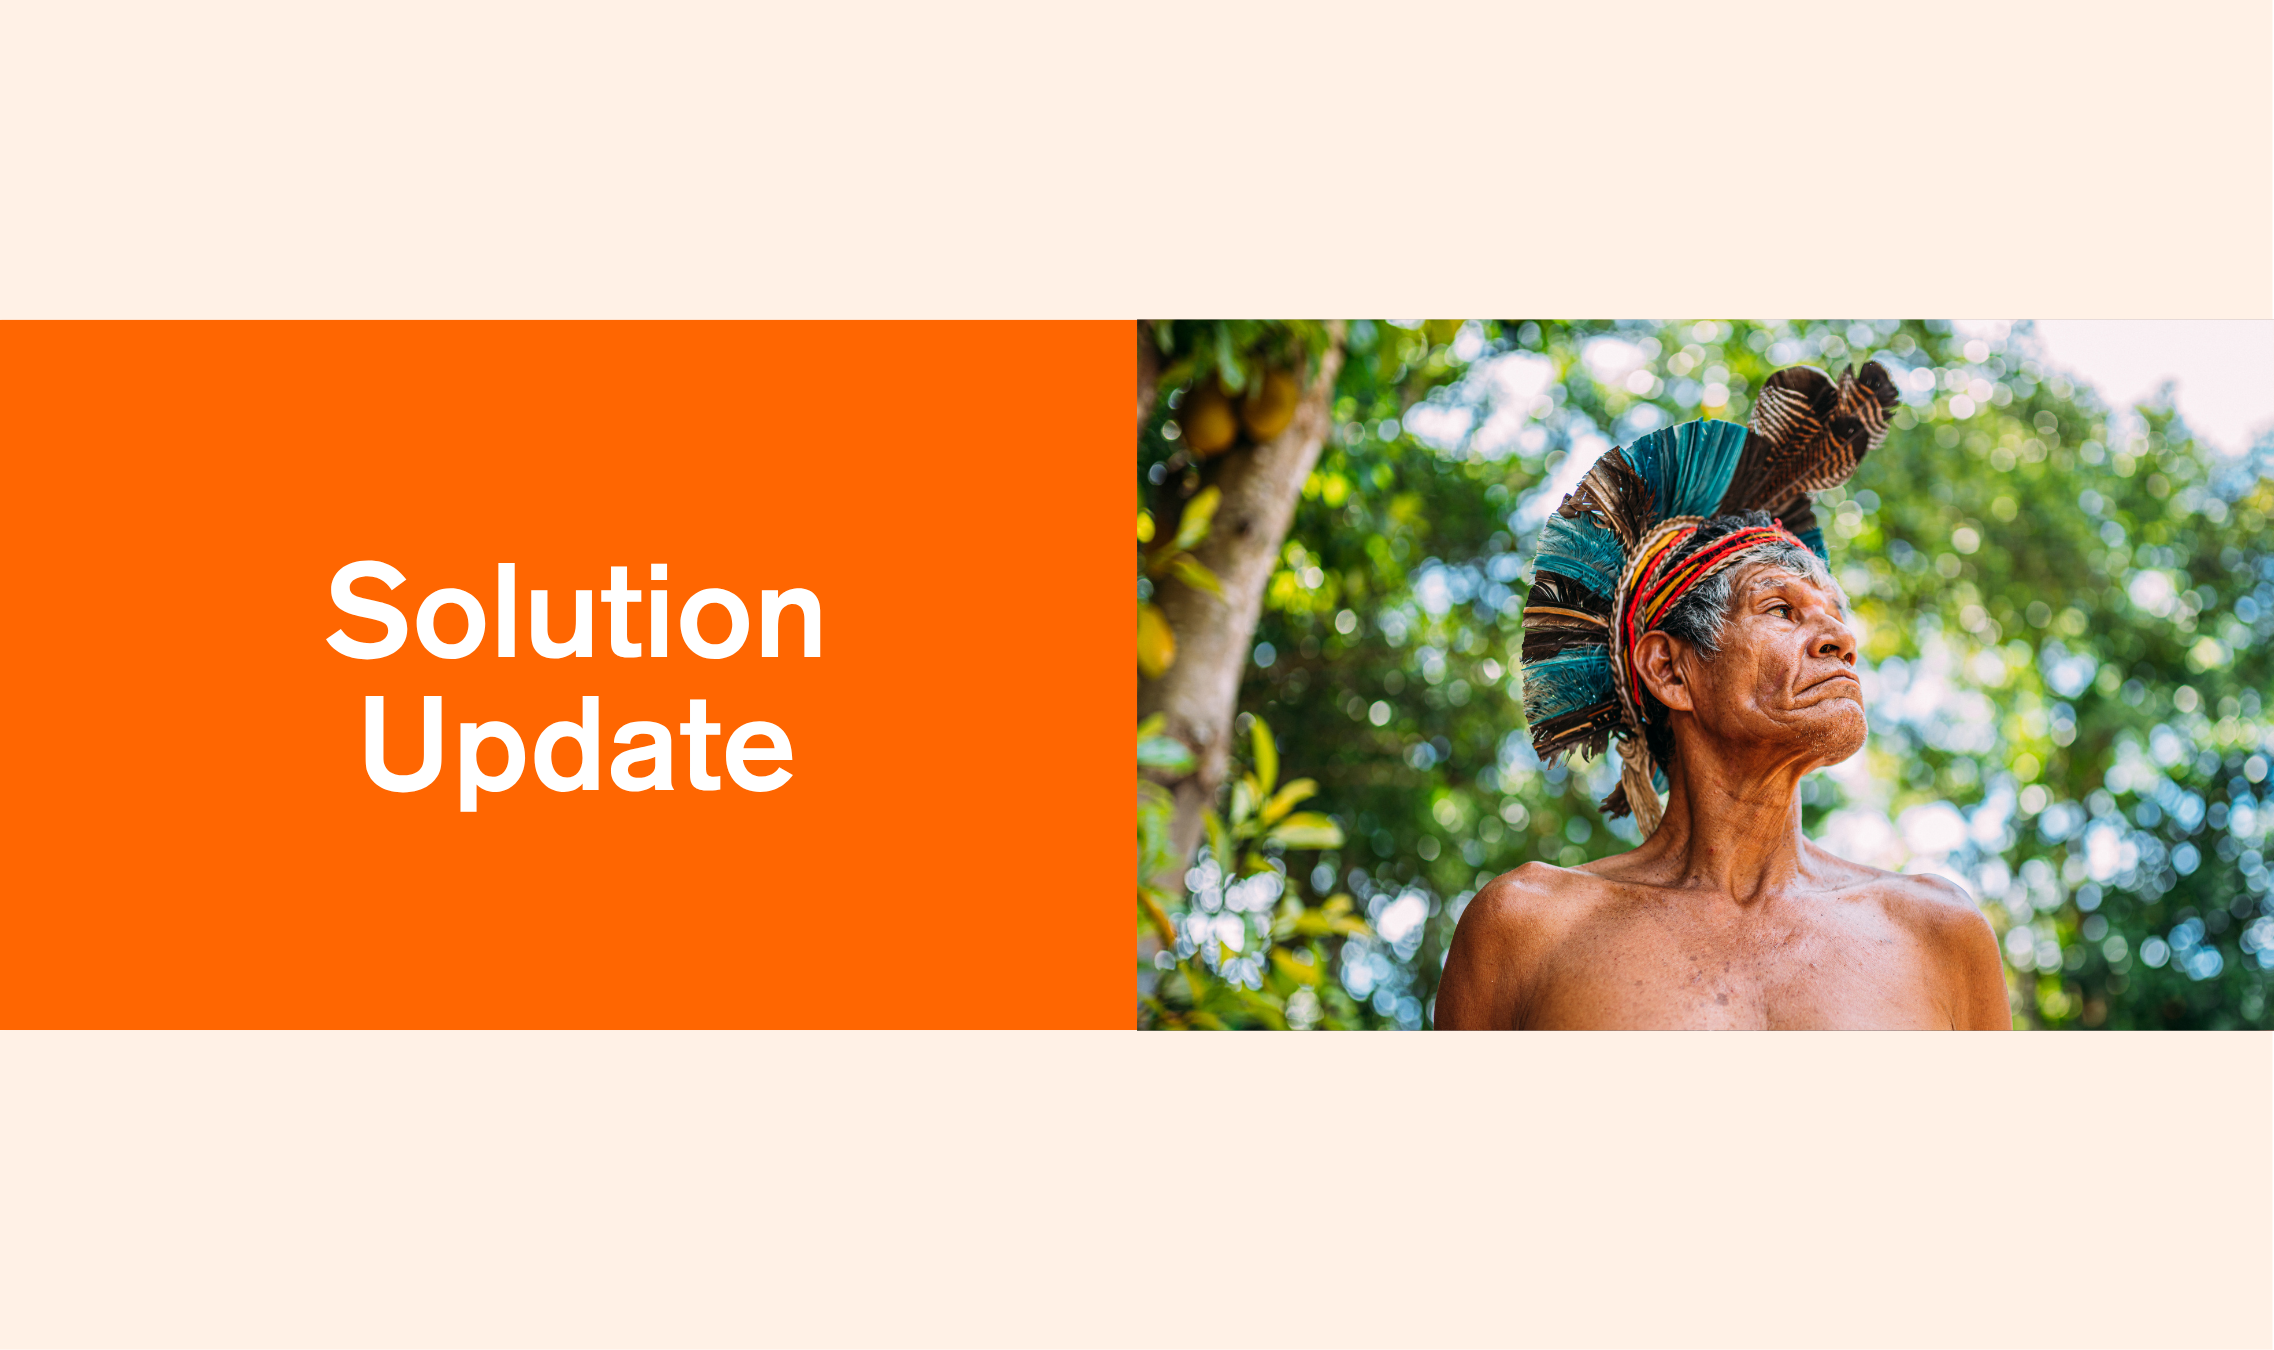


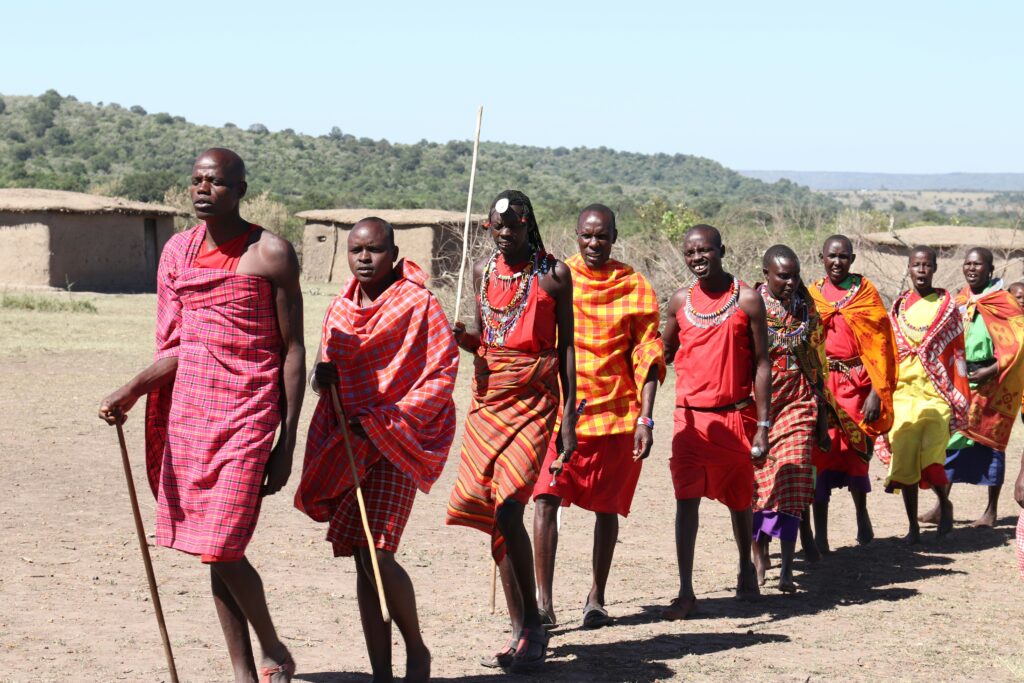
Yanomami. Batwa and Bambuti. Saami. Jenu Kuruba.
Chances are, none of these names are familiar. Yet each is an indigenous community currently in the news for the same reason: loss of habitat to development activity.
This is not incidental. Standard ESG datasets rarely capture indigenous communities. That’s not because they lack materiality, but because no systematic framework has existed to track them at the asset level. For financial institutions, that creates a genuine information asymmetry. Exposure to indigenous land rights risk typically surfaces only after financing decisions are made, not before.
Today, we’re changing that. We are pleased to launch our Indigenous Peoples and Local Communities dataset, the newest addition to our Data Foundations suite, live now on our Data Portal. We built it to close that gap: identifying indigenous land rights exposure at the asset level, so companies can engage meaningfully with Indigenous Peoples and local communities, recognising their role as custodians of the land. This in turn allows investors to price, mitigate, or address risk before committing capital.
Why this belongs in your risk framework
An unrecognised land claim discovered late in the development cycle is materially more costly to address than one flagged at the pre-investment or underwriting stage. Project delays, permit challenges, litigation, write-downs, and reputational damage all compound once investors deploy capital. And unlike many nature-related risks, land rights disputes rarely resolve quietly.
The regulatory direction of travel makes the case even harder to ignore. TNFD identifies meaningful engagement with Indigenous Peoples, Local Communities, and other affected stakeholders as a critical component of assessing nature-related issues. CSRD ESRS S3 asks for evidence-based “affected communities” disclosures in place of generic land-use assumptions. And where assets intersect land held by Indigenous Peoples, UNDRIP and ILO Convention 169 establish Free, Prior and Informed Consent (FPIC) obligations with real legal weight.
However, while nature data has raced ahead to asset-level granularity, the “S” in ESG has lagged behind. This dataset is an exemplar of how social data needs to be more targeted and location-based.
What the dataset brings to light
The dataset identifies the proximity of a company’s physical assets to the territories of Indigenous Peoples and Local Communities. We have off-the-shelf coverage of roughly 10,000 companies, delivering both asset-level and company-level intelligence.
Additionally, at the asset level, three groups of metrics are provided:
- Location details: region and country, the name of the intersecting territory as recorded in the LandMark Global Platform, and the territory’s total area.
- Community details: the principal ethnic groups or communities residing on the territory, and the number of people normally living there.
- Legal status of land ownership: whether the territory is formally recognised, not recognised, or in process; whether the claim is documented or titled; the date of recognition; and the government-assigned land tenure category.
Asset-level results then roll up into company-level exposure metrics that answer the questions every risk or stewardship team will recognise:
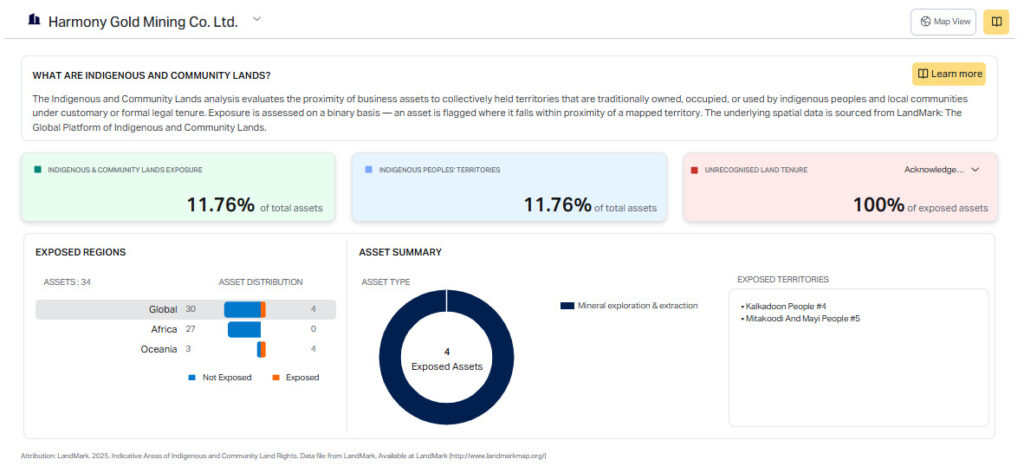
- How exposed is the company? The number and share of assets intersecting at least one indigenous or community land territory.
- How many communities are affected? The total number of distinct territories intersected across all company assets, and the combined area of land involved.
- How much of that exposure sits on legally unrecognised land? The segment carrying the highest conflict and reputational risk.
- Who are the rights-holders? The share of assets intersecting territories whose rights-holders self-identify as Indigenous Peoples versus Local Communities.
Two country-level metrics – total indigenous headcount and indigenous population as a share of the national total – provide the broader geographic context.
On our Data Portal, these roll-ups surface as a single company view. This view shows exposure shares, rights-holder identity, and recognition status, at a glance:
How it works
Each company asset is geolocated and checked against the LandMark Global Platform. This is the world’s leading open database of indigenous and community land territories. We overlay our own asset-level location data on these territory boundaries to produce the exposure metrics above.
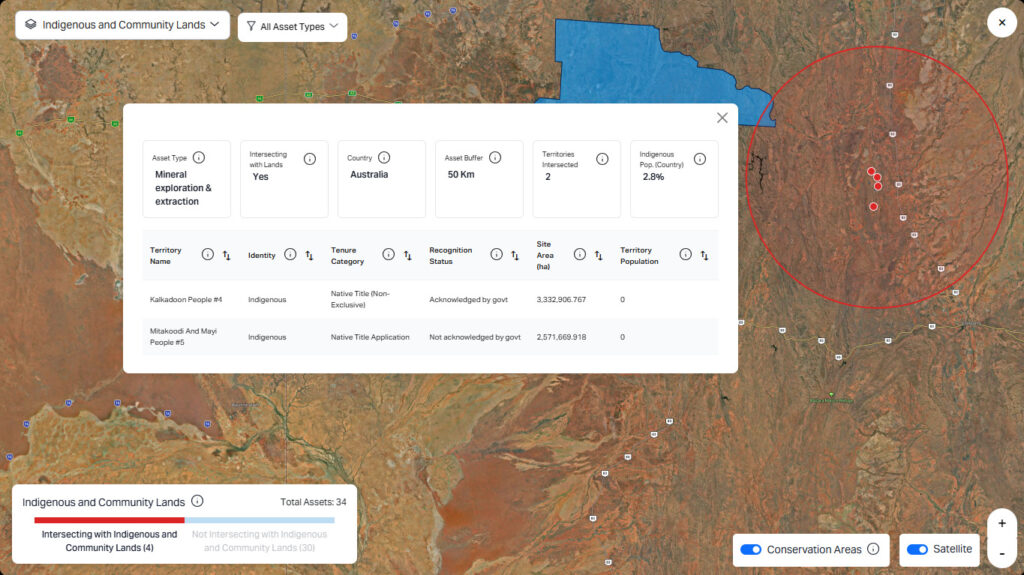
Furthermore, the standard database includes analyses at 5, 10, 20, and 50 km buffer distances. These are common across our nature & biodiversity datasets. We have additional tighter 0.5, 1, 2, and 3 km options also available for this dataset. Because there is no universally prescribed buffer distance for Indigenous Peoples and Local Communities assessments, additional user-defined buffers can be generated on request. Resultantly, the screening logic adapts to your risk appetite, not the other way around.
Here is what that looks like in practice: a single mining asset in Australia, drilled down from the company view:
What “no overlap” means
LandMark has mapped Indigenous Peoples’ and local communities’ lands that together cover 40.1% of the world’s land area. Because experts estimate these communities hold or use at least 50% of the world’s land, LandMark continues to expand its coverage by incorporating additional reliable data.
If an asset shows no overlap, it does not mean the land is free of indigenous or community claims. It may simply sit in an area LandMark hasn’t mapped yet. Absence of a flag should be read as “not yet known,” not “confirmed clear.” We would rather you build that nuance into your screening logic than discover it in a dispute.
Indigenous Peoples vs Local Communities: why the distinction matters
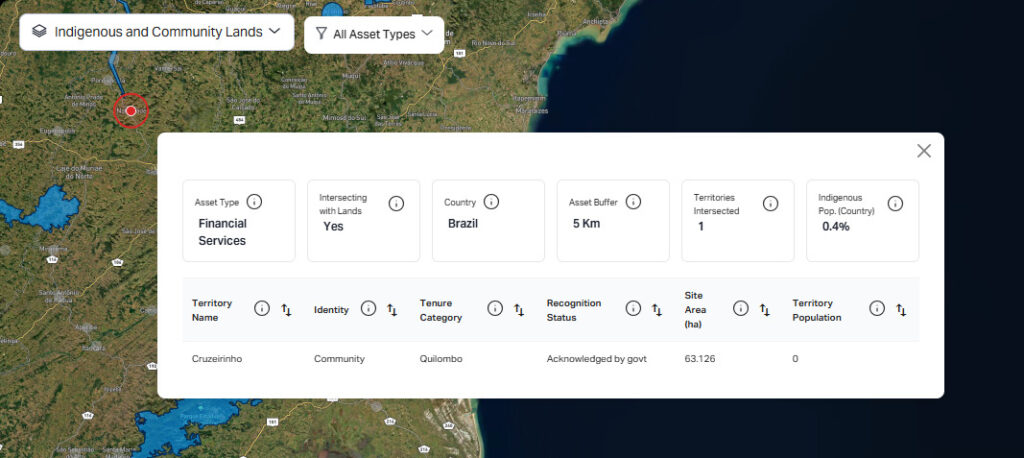
Oftentimes, the two terms are often used interchangeably, but they carry different legal weight, and the dataset flags them separately.
Indigenous Peoples have a specific, internationally recognised definition: communities with continuous historical ties to a territory predating colonisation, who see themselves as distinct from the groups now dominant there, and who are actively preserving their land, identity, and customs. That recognition brings binding consequences: rights under ILO Convention 169 and UNDRIP, including self-determination and FPIC before any development proceeds on their land.
Local Communities may hold long-standing customary land claims, but without an equivalent international definition or standalone rights framework. For an investor or underwriter, the two profiles imply different legal exposure and different engagement obligations, which is why each territory in the dataset carries an identity field, with separate company-level counts for each.
Effective risk mitigation
Every use case for this dataset maps to a specific, nameable risk that today sits unpriced in most books. Four stand out:
- Pre-investment and underwriting screening. Screen whether a prospective site sits on land subject to an active, unresolved, or contested claim before development or financing proceeds. For insurers, exposure on unrecognised territory signals elevated legal and reputational liability, informing risk-adjusted underwriting for mining, infrastructure, and other land-intensive sectors.
- Portfolio screening and escalation. Company-level percentages let asset managers screen entire portfolios for land rights exposure, supporting exclusion lists, positive screening, and engagement escalation triggers. A rising share of assets on unrecognised territory becomes a defensible, data-driven threshold in place of discretionary judgment.
- Stewardship and FPIC planning. Identity and ethnicity fields establish precisely who the rights-holders are, so engagement is directed at the correct community rather than general local outreach. Territory data can also be extended upstream to flag suppliers or sourcing regions overlapping indigenous or community land, supporting rights-positive sourcing in agriculture, mining, and forestry.
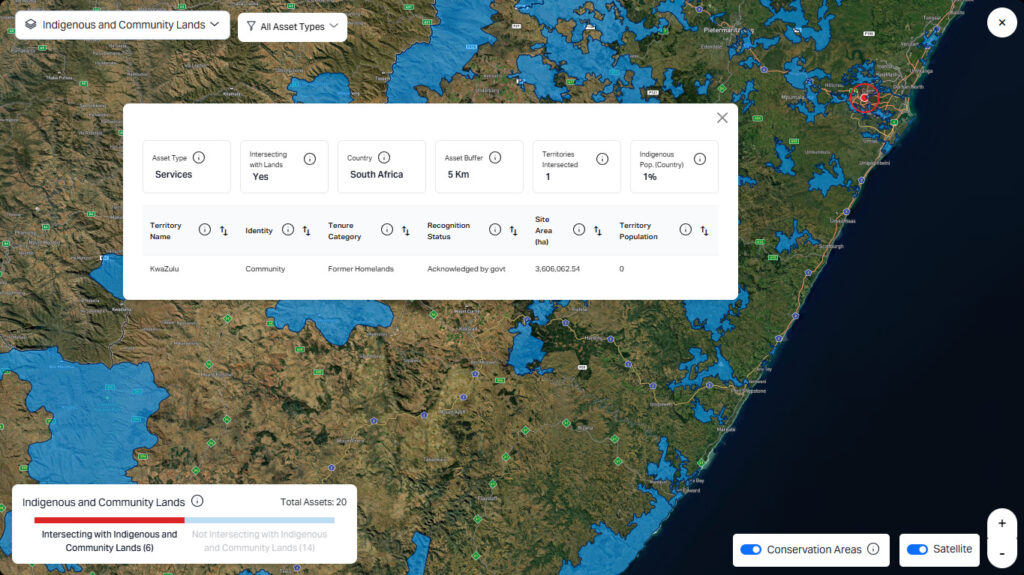
- Disclosure and compliance. The identity, recognition, and documentation fields provide an evidentiary basis for engagement and disclosure aligned with TNFD, ESRS and national permitting requirements
Built for the frameworks you already report against
Ocean Sensitive Areas is designed to feed directly into disclosure. It supports the Locate stage of the TNFD’s LEAP approach, provides the location-specific evidence CSRD ESRS E4 expects on biodiversity impacts, dependencies, risks and opportunities, and maps to the Kunming-Montreal Global Biodiversity Framework (Targets 3, 14 and 15).
However, a note on scope: this is a location-based screening tool, not an impact-magnitude assessment. It tells you which assets warrant a closer, site-specific look — the objective first filter, not the final word.
Ready to see if your portfolio of assets is exposed to the territories of Indigenous Peoples and Local Communities?
Reach out to the GIST Impact team for a walk-through of the dataset today.