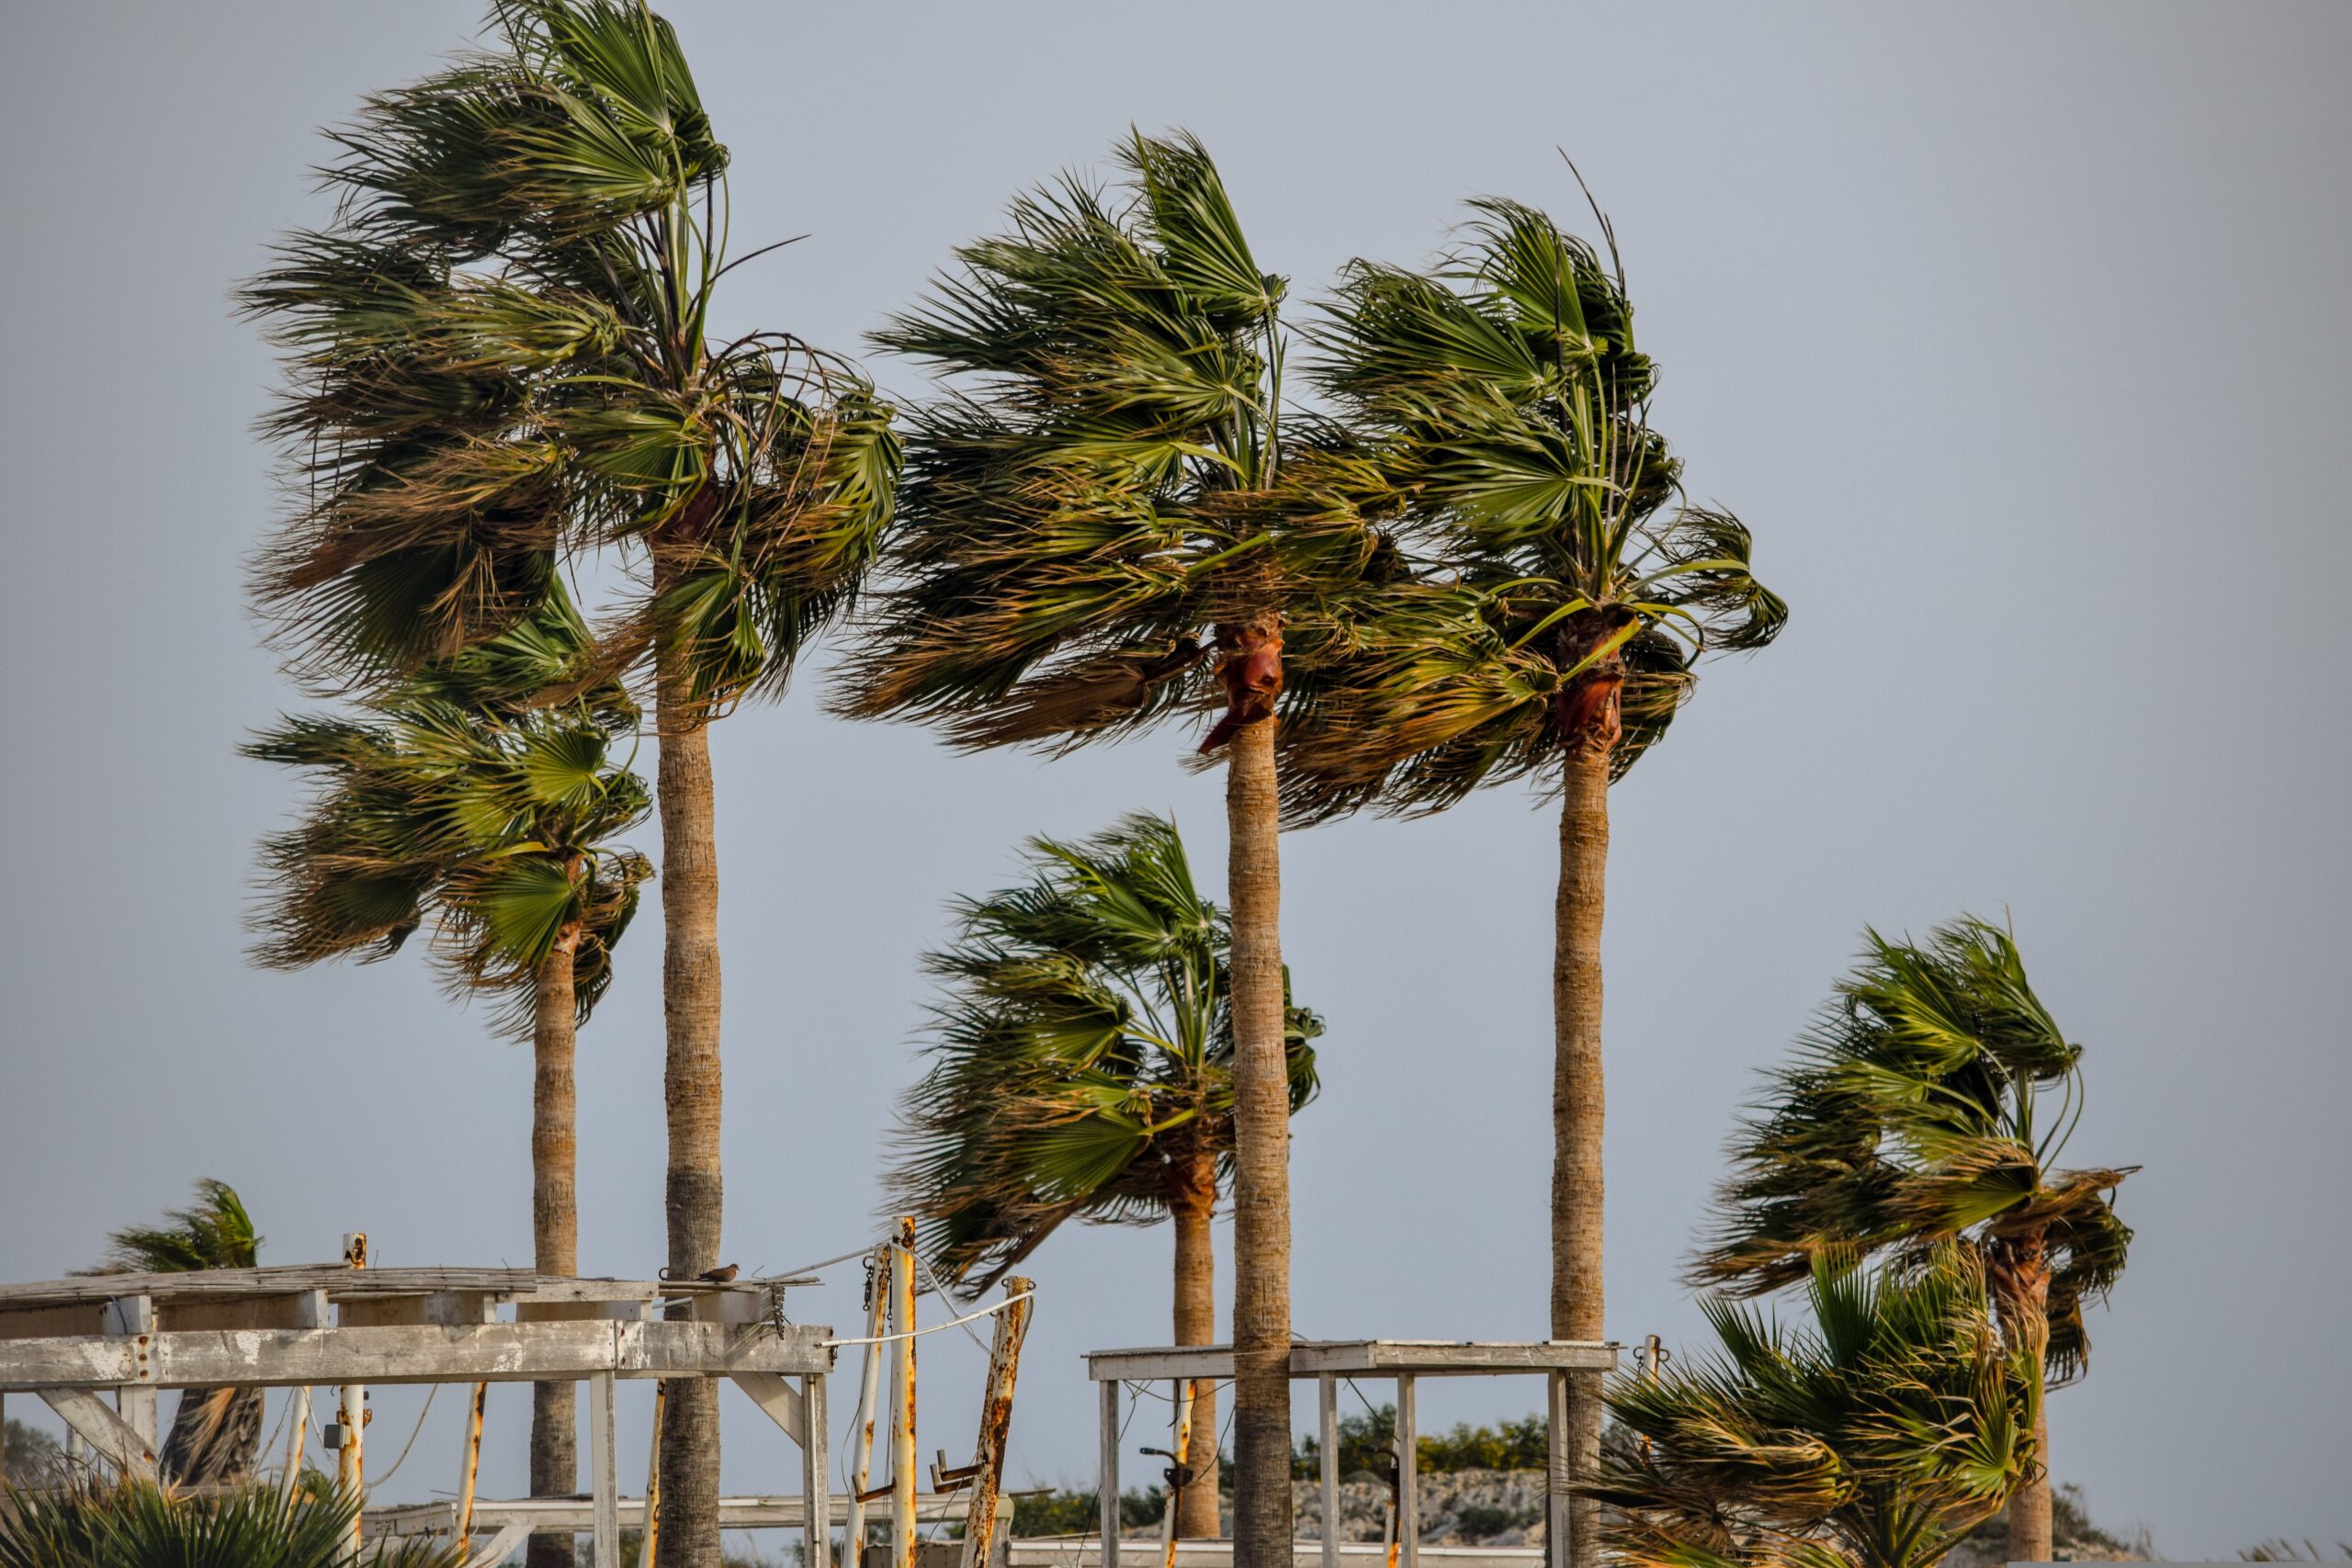


The World Meteorological Organisation (WMO) confirmed that El Niño is now firmly established and intensifying. Forecasters expect the event to become very strong, with a nearly 100% probability of persisting through February 2027. For financial institutions (FIs), a simple forecast like this is a critical signal, because this event is on track to become a Super El Niño – the more extreme version of the climate pattern.
What is El Niño?
El Niño is a periodic warming of Pacific Ocean surface temperatures that weakens trade winds and shifts rainfall and pressure patterns across the globe. It happens naturally every two to seven years. But roughly once every 10 to 15 years, ocean temperatures spike more than 2°C above average. The result is what scientists call a Super El Niño.
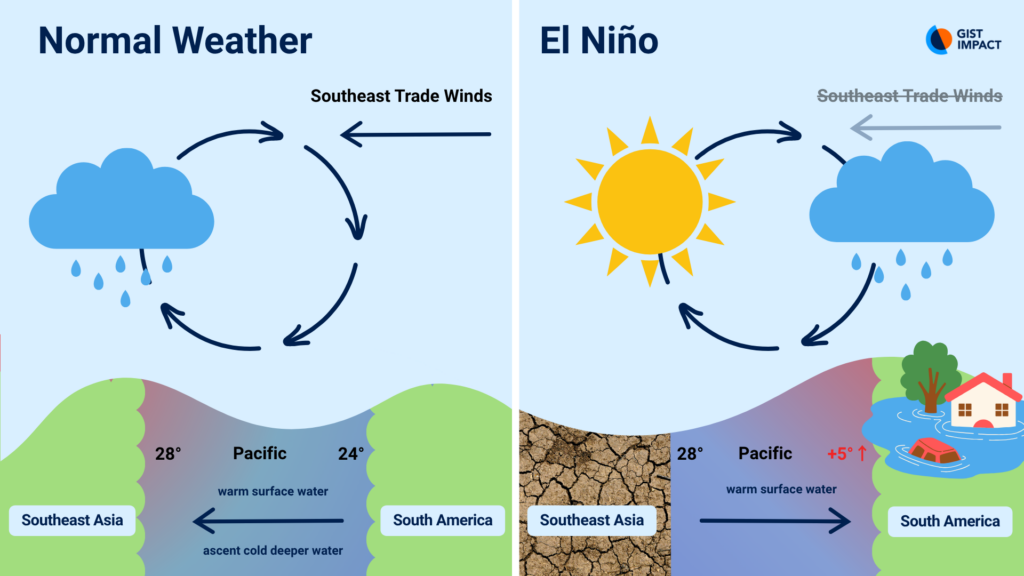
El Nino-related weather events reshape atmospheric circulation on a global scale, enough to:
- Drive extreme heat and temperature swings that stress crops, livestock, and infrastructure.
- Shift rainfall patterns, with drought in some regions and flooding in others, often at the same time.
- Put stress on marine ecosystems, disrupting them and the industries built on them.
So, why does this matter? El Niño Southern Oscillation (ENSO) impacts vary significantly by region and season. According to the WMO, El Niño typically drives severe drought across Indonesia, southern Africa, parts of South Asia, and northern and eastern Australia, while triggering heavy rainfall across East Africa, the southern US, and parts of South America. It doesn’t hit everywhere the same way. This simultaneous, multi-continent disruption is what turns a regular climate event into a financially material one.
Take Taiwan Semiconductor Manufacturing Company (TSMC) for example, the world’s largest semiconductor chip manufacturer. Instinctively, you may think that chipmaking has nothing to do with rainfall. Yet, TSMC’s production hinges on a steady supply of ultra-pure water. This is why the World Economic Forum has flagged El Niño as a systemic risk to the whole semiconductor supply chain. We’ll be analysing TSMC’s risk further in the blog.
What would a Super El Niño cost the global economy?
For this year’s El Niño event, losses are estimated to reach $3 trillion to $5 trillion over five years. That’s roughly 2.7% to 3.2% of global GDP, according to Citigroup economists. In a full-scale Super El Niño scenario, that figure climbs as high as $7 trillion, or about 6.4% of global GDP. For context, the 1997-98 Super El Niño event is considered as the most economically destructive El Niño on record, costing the world an estimated $5.7 trillion.
Dartmouth College researchers take an even longer view. They project $84 trillion in cumulative losses across this century. According to the WMO, while climate change doesn’t necessarily increase El Niño’s frequency or intensity, higher global temperatures significantly amplify its real-world impacts. The 2023 El Niño has shown clear evidence of this. Researchers found that the drought that hit the Panama canal in 2023 was highly unlikely without El Niño, and notably, it carries around 5% of global maritime trade. Daily ship crossings dropped from 36 to 25 – highlighting how El Niño impacts trade flows and supply chains.
This cycle is compounding on multiple fronts. Global supply chains are already strained by the US-Iran conflict and the fuel, food, and fertiliser shortages it triggered. Additionally, El Niño is unfolding on the warmest run of years on record. So the same drought now does more damage than it would have a decade ago. Historical loss data from past cycles likely understates what this one could cost, and the financial materiality is hard to miss. That combination of intensified physical climate risks, ecosystem disruption, and strained supply chains flows straight into credit quality and portfolio valuation.
The issue of timing
The bigger issue for FIs is timing. Losses persist for years after the event fades. Growth can slow for a decade or more, hitting tropical, lower-income economies hardest, though it reaches countries like the United States as well. Consequently, that turns El Niño into a multi-year drag on growth and creditworthiness specifically in agriculture and commodity-linked sectors. This stretches the risk window for lending and portfolio decisions well past the event itself.
How do you price in El Niño risk?
The potentially trillion-dollar question is how to price in El Nino risk. Managing this exposure requires identifying, modeling, and pricing El Niño induced nature and climate risk accurately, which is precisely what our product suite is designed to do.
We have developed a Nature Value-at-Risk (NVaR) scenario analysis for El Niño. Think of this scenario as a stress test of concentration risk. It asks a simple question: if the 2026-27 El Niño disrupts the ecosystem services a company relies on, directly or through its suppliers, how much pressure does that put on its cash flow?
The model starts by linking climate conditions to the ecosystem services they threaten. Drought puts water supply and biomass provisioning at risk. Heavy or intense rainfall threatens rainfall regulation and flood control. Extreme heat strains local climate regulation, and a higher cyclone risk strains global climate regulation. That’s six ecosystem services in total, with the ability to be mapped across 34 countries.
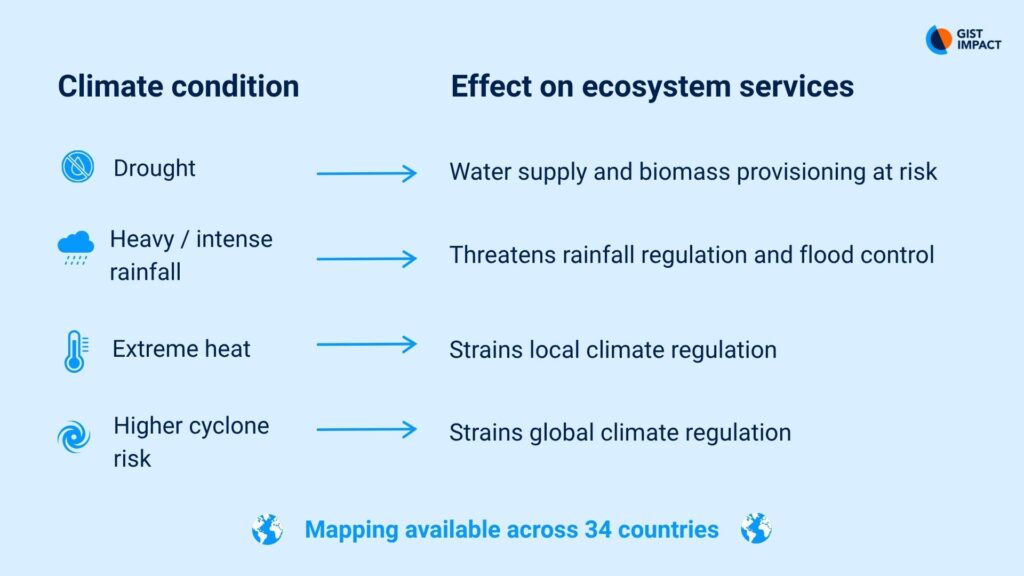
Each country is then flagged only for the services El Niño actually threatens there, on a simple yes-or-no basis. A country only counts as exposed on a given service if the local climate impact actually puts it at risk. At the company level, our model estimates the potential production or output loss and converts that into revenue-at-risk. That captures both direct operational impacts and upstream supply-chain exposure. From there, results roll up from company level to portfolio-level exposure. That’s on both an issuer-level, unweighted basis and a portfolio-weighted basis, giving institutions a read on El Niño risk at whichever altitude a decision calls for.
What does El Niño risk look like for TSMC?
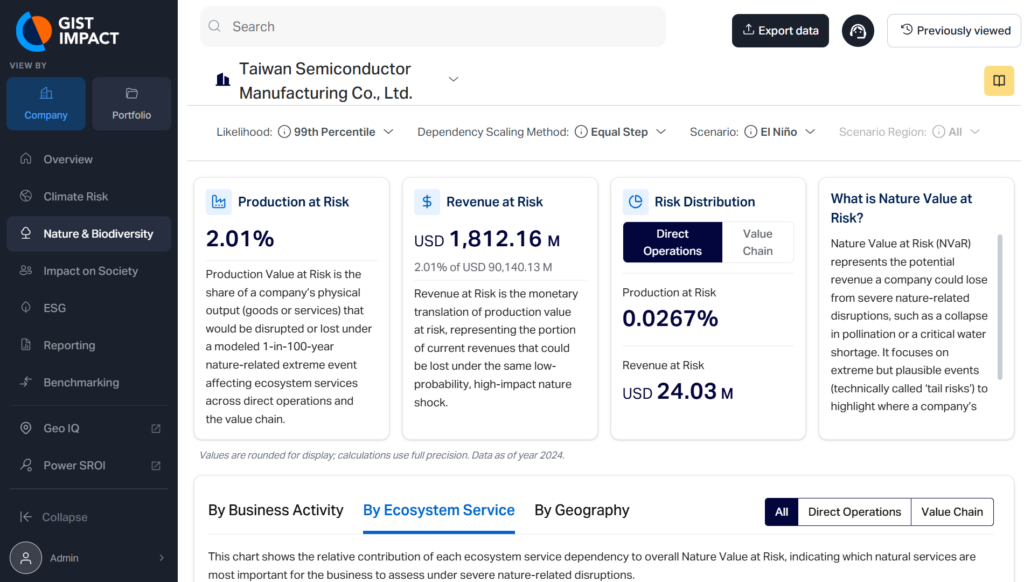
Under our El Niño scenario at the 99th percentile, TSMC’s production at risk comes to 2.01%. That’s $1.81 billion of revenue at risk, against a revenue base of roughly $90 billion. Almost none of that sits in TSMC’s own factories. Direct operations account for just $24 million of it. The rest, more than 98%, sits upstream in the value chain.
That split changes where a credit or engagement team should focus. The real questions, about water contingency planning and alternate sourcing, actually belong with TSMC’s suppliers since that’s where most of the risk sits.
Geographical concentration in Taiwan matters too, and it isn’t just a TSMC issue. TSMC sits in roughly two-thirds of global active managers’ portfolios and more than 90% of Asia ex-Japan funds, according to Benzinga’s analysis of TSMC’s ownership concentration. So a portfolio holding TSMC alongside other companies that depend on the same island isn’t as diversified as it looks. It’s the same exposure, counted several times over, just under different labels.
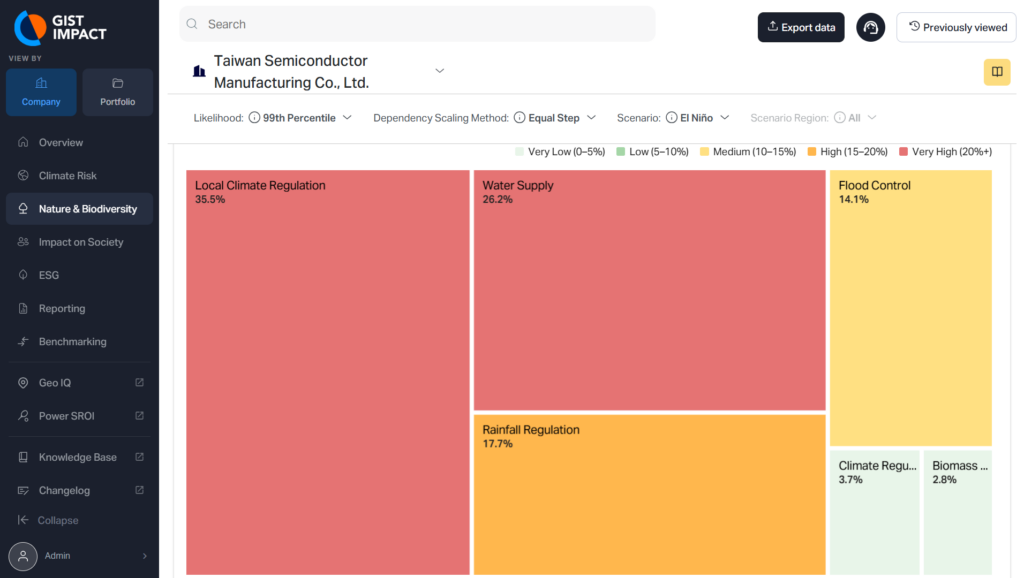
Our ecosystem-service breakdown adds nuance that most coverage of TSMC’s water risk misses. Local climate regulation drives the largest share, at 35.5%, ahead of water supply at 26.2%. Moreover, rainfall regulation and flood control make up most of the remainder.
Where the exposure sits
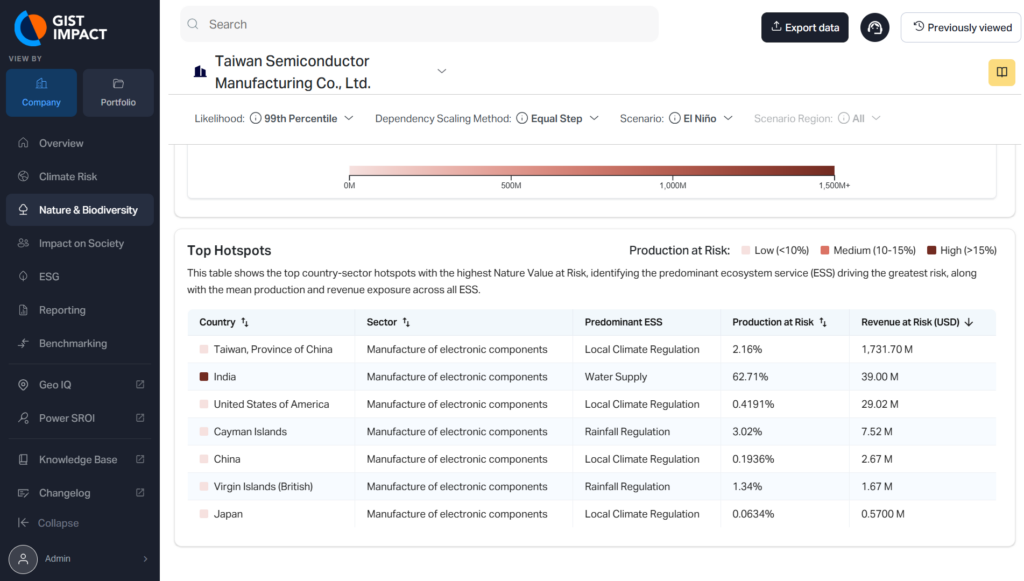
The geographical breakdown tells its own story. Taiwan carries the bulk of the dollar exposure, at $1.73 billion. India shows the highest relative production risk in the model, at 62.71%, on a much smaller revenue base. Surprisingly, the United States ranks as the third-most exposed country, despite sitting thousands of kilometres outside of East Asia.
TSMC is one of the most widely held stocks in global portfolios and for most investors, it reads as pure technology exposure. Taiwan produces around 90% of the world’s most advanced semiconductors, with TSMC at the center of that supply, so keeping its plants running is a shared global concern.
Why does this matter?
TSMC has already lived through a version of what the El Nino may present. A 2021 drought, Taiwan’s worst in decades, forced the company to truck in water for months to keep its operations running. We previously analysed this exposure in their supply chain under a “Water Shock” scenario, where we modelled a 1-in-100-year extreme event defined by acute water stress and significant water quality degradation across East Asia. Running TSMC against this El Niño scenario shows the risk hasn’t gone away.
This analysis is important because FIs can screen companies and portfolios to pinpoint El Niño exposure, model how risks evolve, and target interventions where impact is highest, focusing resources on the most vulnerable assets first.
What you can do
Super El Niño losses play out over years, compounding as they go, and this cycle is landing on a warmer baseline with existing supply chain fragility already in the mix. A nature and climate risk proposition that quantifies exposure at the geographic, sectoral, and asset level is what turns that uncertainty into something a portfolio or lending team can act on. Addressing this challenge head-on is possible thanks to our newly launched Nature Value at Risk (NVaR) El Niño scenario analysis.
—
Talk to our team to see how we can help you manage your El Niño-related risks.