


Water risk is rapidly moving to the top of the institutional agenda, and the financial system is paying attention.
Water, water, everywhere
The Network for Greening the Financial System (NGFS) is expanding its research into how nature degradation affects inflation, financial stability and macroeconomic outcomes. More importantly, it has named water availability as one of its first priority topics. Companies are already feeling the economic impacts:
- According to CDP, companies report $1.4bn in financial impacts from water issues and expect a further $400bn in future impacts.
- These range from disruption costs to regulatory risk and capex requirements.
- Yet more than a third of companies lack processes to assess and manage water risk.
- Strikingly, only 54% of financial institutions (FIs) assess their portfolio’s exposure to water risks and opportunities.
The appetite and the urgency to assess water risk are there. The real bottleneck is getting hold of high-quality, usable data, and knowing exactly how and where to put it to work.
This piece will walk through how financial institutions can operationalise the TNFD’s LEAP (Locate, Evaluate, Assess, Prepare) approach for water risk. We show what our water risk intelligence looks like across a major portfolio, before drilling down into a single-company to demonstrate exactly how granular our data gets.
Why is water risk a portfolio issue?
Every portfolio has a water footprint, whether or not it is currently being measured. Where investee companies’ assets sit, and whether those locations are water-stressed, is becoming a core question in portfolio analysis.
High water exposure brings two kinds of risk:
- Beginning with the obvious one, physical risk: flooding, shortage and drought can halt production, raise operating costs or damage assets.
- Transition risk is slower but just as material, where regulatory tightening and community pushback can strand or force the costly relocation of poorly sited facilities.
Regulatory drivers also support this. The TNFD framework is voluntary, yet water already features in mandatory rules. The EU’s revised ESRS keeps a dedicated water standard (E3), and SFDR includes an indicator on investments in companies with sites in areas of high water stress. IFRS S2 counts drought and reduced water availability as physical risks, and SEBI’s BRSR Core requires India’s top 1,000 listed companies to report water consumption and discharge. In October 2026, the ISSB also published nature-related disclosure proposals for consultation, naming water-stressed areas as a sensitive location and asking companies to break down their nature-related risk metrics by location.
Leading investors are already acting. In alignment with the TNFD, Norges Bank Investment Management (NBIM) screened 642 technology companies and 30,348 of their assets for proximity to areas of high physical water risk, very high water demand and Key Biodiversity Areas, using GIST Impact asset-location data among other sources.
Northern Trust Asset Management’s analysis of water risk also included our data, which looked at where companies are exposed to water stress and how well they are managing it.
Why do current water assessments fall short?
Many FIs still rely on tools such as WRI Aqueduct, the WWF Water Risk Filter and ENCORE. These are authoritative, but Aqueduct and the Water Risk Filter score river basins and ENCORE scores sectors, so investors still need to know where each company’s assets are and what they do. Additionally, averages hide outliers: NBIM found that less than 6% of a typical portfolio company’s assets sit near sensitive locations, but noted that the figure masks significant exceptions. Also, open source data rarely tells a factory from an office, even though one may depend heavily on water and the other barely at all. And most assessments remain static snapshots. Our granular water risk data, scored by location and business activity, closes these gaps.
Water Risk from a Portfolio Lens
LEAP across the MSCI ACWI
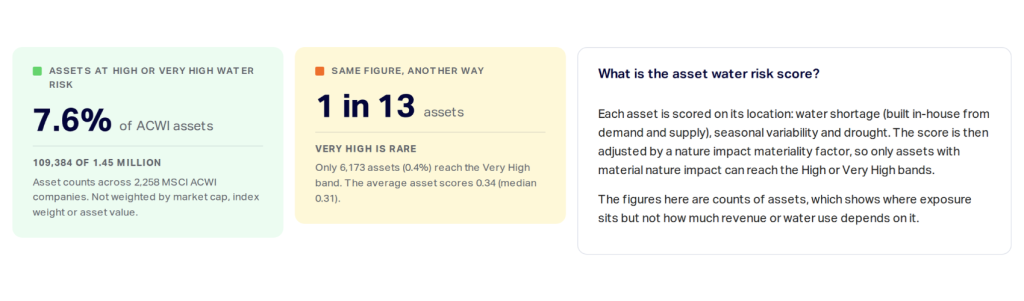
Our water risk data is available at the portfolio, company and individual asset level. To showcase our data in practice, we applied it to one of the world’s most widely followed benchmarks, the MSCI ACWI. It spans developed and emerging markets, so most global investors will recognise their own holdings in it. We assessed around 1.45 million assets owned by 2,258 ACWI companies on water shortage, seasonal variability and drought.
Locate: where is the exposure?
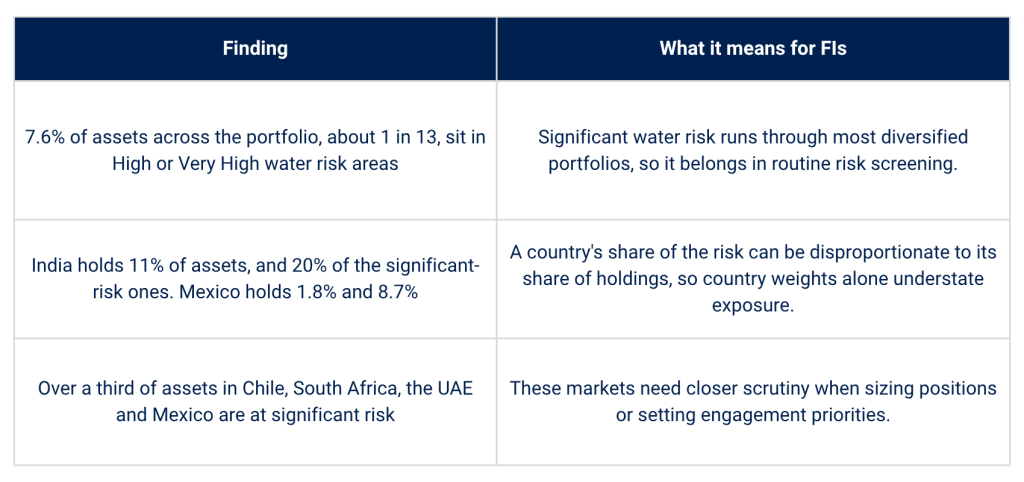
Firstly, it’s important for investors to know where specifically water risk sits. Here is what the index shows.
Evaluate: what drives it?
Location is only part of the story. What an asset does also shapes its risk, so our score accounts for how heavily each asset’s activity relies on water.
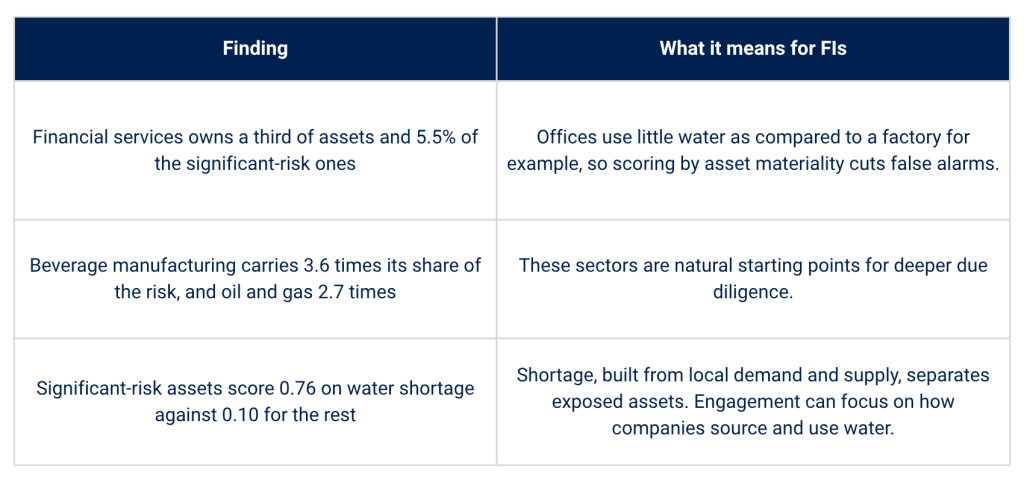
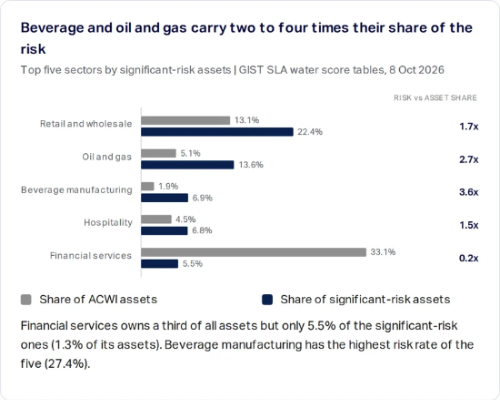
Assess: where does it concentrate?
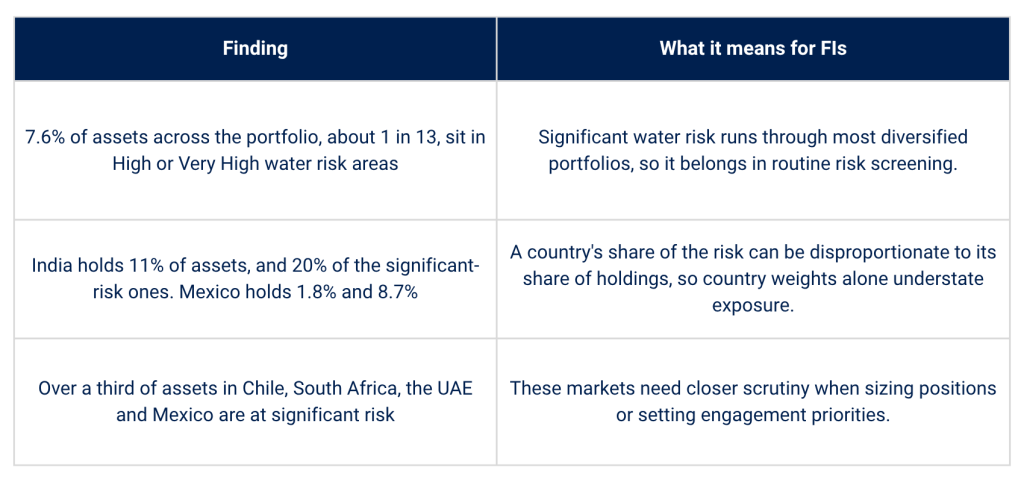
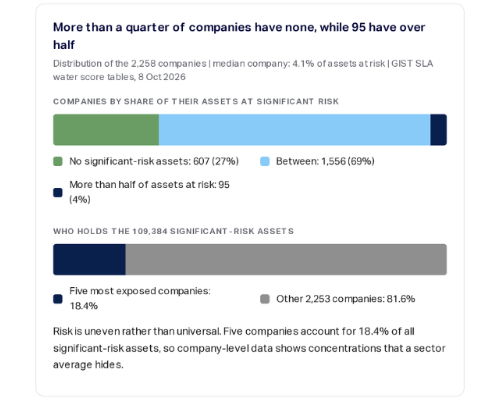
Location is only part of the story. What an asset does also shapes its risk, so our score accounts for how heavily each asset’s activity relies on water.
Each exposure is read through two lenses:
- The Business Material Score covers financially material assets, showing where engagement matters most.
- The Nature Dependency Material Score uses a dependency lens: it picks out assets whose activity relies on water at a High or Very High level and scores them against the water stress of their basin.
This flags the transition, reputational and legal risks that a purely financial screen can overlook.
Prepare: what should investors do?
With the exposure located and ranked, the final step is action. For an ACWI-benchmarked portfolio, that could mean:
- Screening holdings against high-risk countries and sectors
- Prioritising engagement with the few companies that hold most of the risk
- Setting water expectations for those sectors and repeating the analysis each year to track performance
Company Deep Dive: Reliance Industries
To see how this works at the company level, we turned to Reliance Industries, India’s largest private sector company. Reliance runs the world’s largest single-site refining complex at Jamnagar, more than 19,000 retail stores and the Jio digital business. It ranks 88th on the Fortune Global 500, exports diesel to Europe, and recently partnered with Meta. Its mix of water-intensive and water-light businesses makes it an insightful example for FIs.
Locate
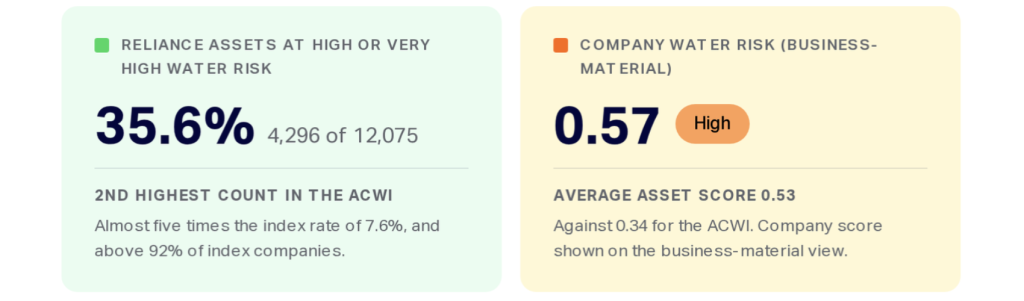
Reliance has 12,075 assessed assets in 17 countries, and 99.6% of them are in India. Of these, 35.6% (4,296) sit in High or Very High water risk areas. That’s almost five times the index rate and the second-highest count in the ACWI.
Evaluate
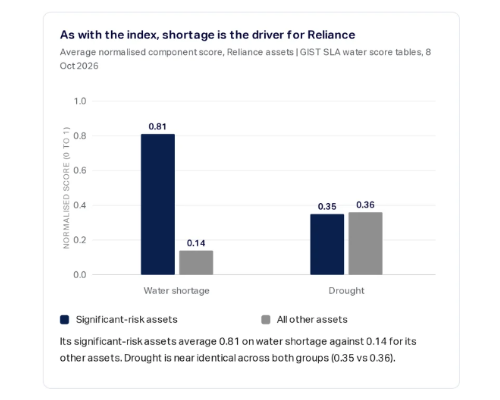
The risk sits in its physical footprint: grocery retail, petroleum extraction, wholesale and energy transport. Its 2,165 software and cellular-service assets carry no significant risk. Here too, water shortage drives the result.
Assess
Reliance’s company water risk score is High (0.57). It owns 7.3% of the index’s assets in India and 19.6% of the significant risk there. For an investor with India exposure, this single holding carries a disproportionately large share of water risk. In TNFD terms, that points to physical risk from shortages, reputational risk where large sites draw on already stretched supplies, and liability risk as water rules tighten.
Prepare
This level of water risk intelligence allows investors to have a focused engagement agenda. The agenda can be built around questions such as:
- Which retail and petroleum sites face the highest water shortage, and where does their water come from?
- What recycling, storage or alternative supply is in place at those sites?
- How does water availability shape decisions on new sites?
What our data covers today, and what’s next
Covering around 13,000 companies at the asset level, our water data spans two suites, so FIs can read the same assets through a climate lens and a nature lens. In our Climate Risk suite, a thematic water risk score shows overall exposure, and drill-downs into each hazard layer reveal whether flooding, drought or another hazard drives it. Results break down by country, hazard, asset type, severity (from Very Low to Very High) and business materiality: the sites whose loss would most hinder a company’s revenue or productivity. For example, an analyst could see that 10% of a company’s most material assets sit in Peru and face high drought risk.
Our Nature and Biodiversity suite helps financial institutions understand water-related risks at the asset level. Each asset receives a score based on two key factors: how water-stressed its surrounding river basin is, and how much the asset relies on water for its operations. The assessment considers factors such as water scarcity during droughts, changing groundwater levels, water storage, the health of local ecosystems, and a country’s ability to adapt to environmental challenges.
It offers business-materiality and nature-materiality views. These help financial institutions identify assets exposed to water stress, understand which assets depend most on nature, and assess where water-related risks could affect business operations. Company-level scores also account for reported water use. All scores reflect current and historical conditions.
Looking ahead, we are exploring ways to link asset locations directly to revenue. This would help distinguish between assets that are important to a company and those that are critical to its financial performance. For example, if a company operates 500 facilities but just two generate 40% of its revenue, and those two facilities are located in areas facing high water risk, that concentration could represent a significant business vulnerability. Connecting water risk with revenue contribution would help financial institutions better understand where risks exist, and where they matter most.
___
Curious to see if your portfolio’s in hot water? Get in touch with our team to assess your water risks today.